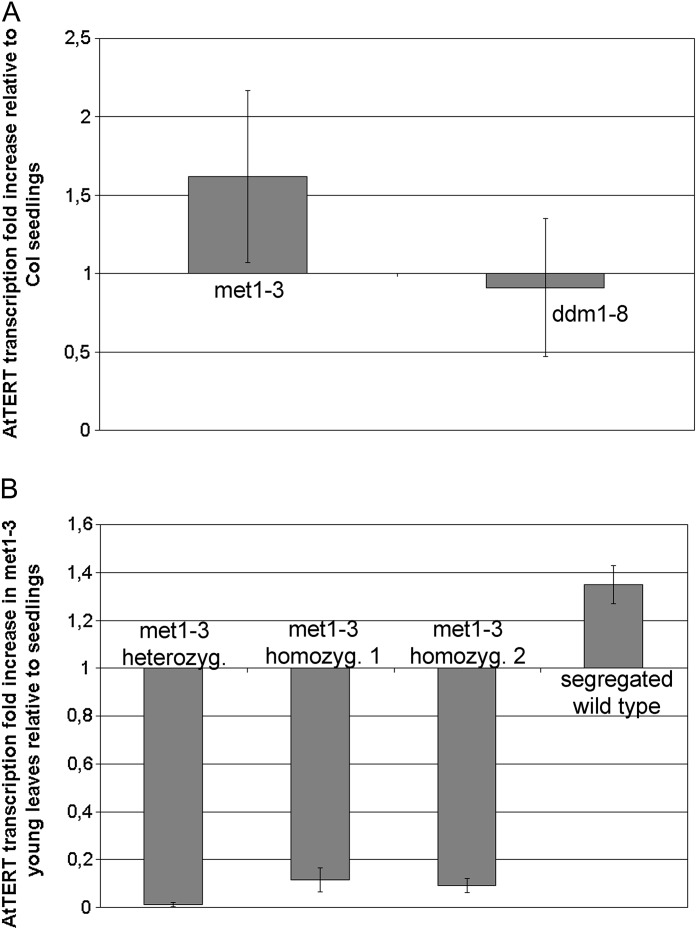
Fig. 2.
Analysis of AtTERT transcription in methylation mutants. (A) AtTERT transcription in 7 day seedlings from methylation mutants. Analysis was done using four biological replicates of seedlings from four ddm1-8 homozygous plants and from four met1-3 heterozygous plants. Amplification of a 110 bp fragment of the AtTERT exon 1 was expressed relative to the ubiquitin endogenous control. The ΔΔCt method (Pfaffl, 2004) was used to calculate AtTERT transcription. Error bars show SD. No significant change of the AtTERT transcript level as compared to wild-type seedlings was observed. Col, Columbia wild-type. (B) AtTERT transcription in young leaves from met1-3 plants (one heterozygous and two homozygous representatives; homozygous plants were selected with extremely low frequency and did not grow up to the reproductive stage, as previously reported by Saze et al., 2003) and from segregated wild-type plants. AtTERT transcription in met1-3 young leaves was significantly lower compared to wild-type samples (Supplementary Fig. S1).

