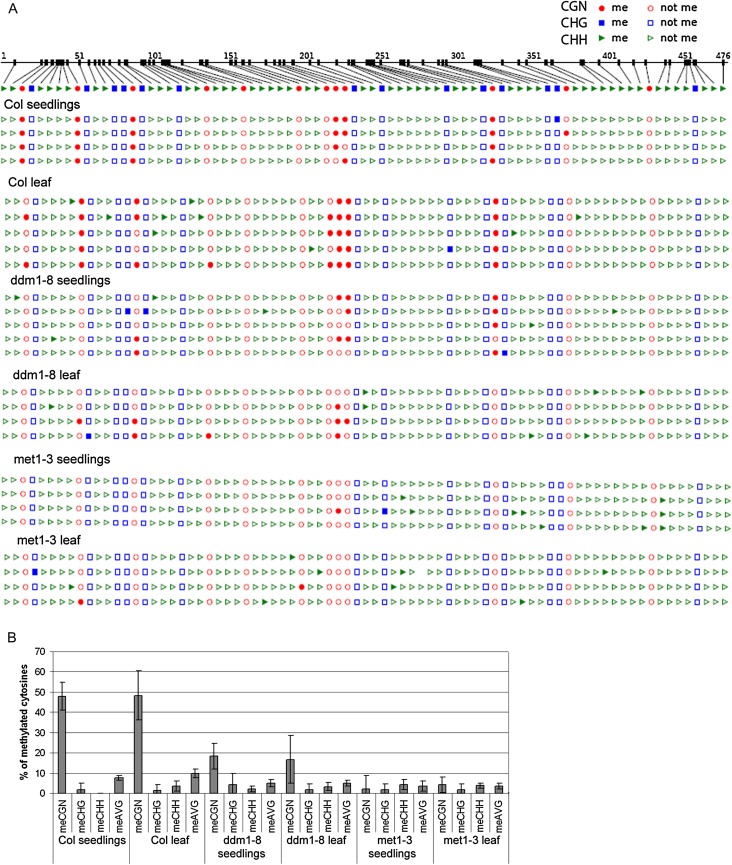
Fig. 3.
Analysis of DNA methylation in AtTERT exon 5 by bisulphite genomic sequencing. (A) Distribution of methylated cytosines along the 476 bp region of exon 5. Seven day seedlings and mature leaves (leaf C, Fig. 1A) from wild-type and methylation mutants were subjected to analysis. Col, Columbia wild-type; CG methylation, red circles; CHG methylation, blue squares; methylation of cytosines in a non-symmetrical sequence context, green triangles; filled symbols, methylated cytosine; empty symbols, non-methylated cytosine. Twelve cytosines in CG, 14 cytosines in CHG, and 53 cytosines in CHH were evaluated. (B) Graphical representation of the methylated cytosine content in the respective sequence context in tissues of wild-type and methylation mutant plants. Note the comparable level of methylated cytosines in tissues of the same genotype. In all met1-3 and ddm1-8 clones, the level of methylated cytosines in a CG sequence context was decreased significantly, and this drop was more pronounced in the met1-3 mutant background. meAVG, average cytosine methylation.

