Fig. 1.
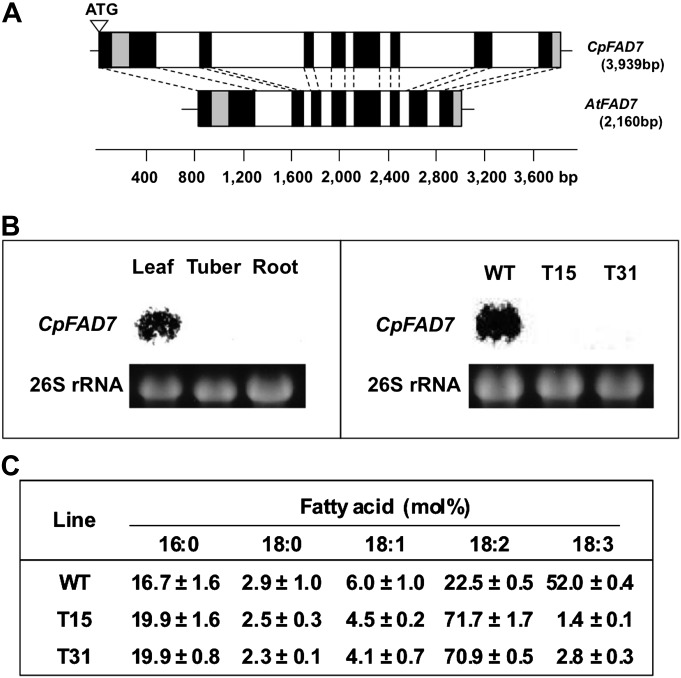
Production of transgenic lines with low TA contents. (A) Comparison of CpFAD7 and AtFAD7 gene structures. White and black boxes represent introns and exons, respectively. The grey boxes indicate regions of low homology between CpFAD7 and AtFAD7. (B) Expression of CpFAD7 in WT and transgenic lines. Northern blot analysis of CpFAD7 expression in WT leaves, tubers, and roots (left), and in leaves of WT, T15, and T31 plants (right). The blots were hybridized with a full-length CpFAD7 cDNA as probe. The denaturing RNA gels were stained with ethidium bromide, and 26S rRNA bands were used as loading controls. (C) Composition of fatty acids in leaves of WT and transgenic lines (T15 and T31). Values are means ±SD (n=3). Plants were grown to seedling stage (4–5 leaves) on half-strength MS medium at 20 °C under 16 h light (70 μmol m−2 s−1).

