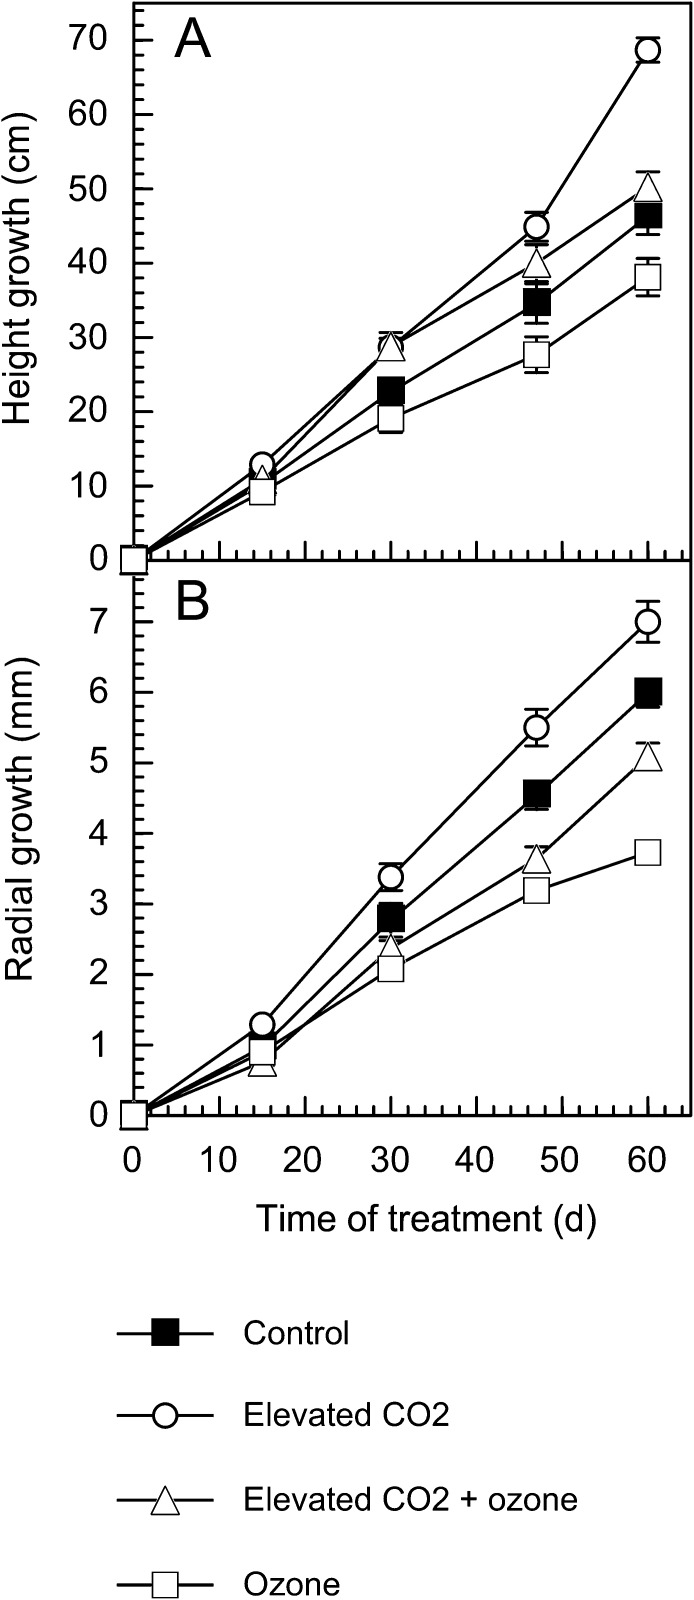
Fig. 1.
Height (A) and radial (B) growth of poplars since the beginning of the treatment, i.e. height and diameter differences compared with the height and diameter at time zero. Trees were grown for 60 d under control (filtered air), ozone (200 nl l−1), elevated CO2 (800 μl l−1) or a combination of ozone and elevated CO2 conditions. Values are mean ±SE (n=6).

