Figure 2.
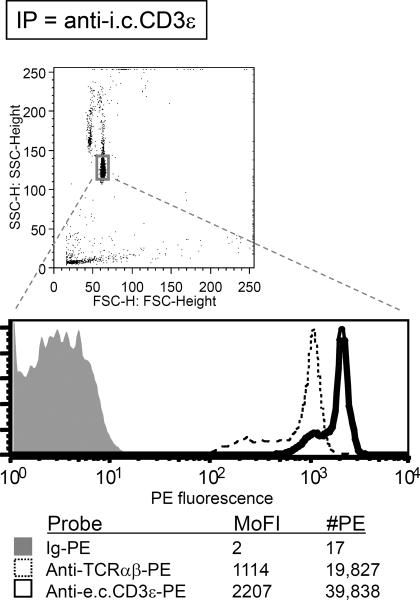
An example of data from IP-FCM. The method was performed according to the described protocol by lysing 50 × 106 human peripheral blood mononuclear cells in 1% Digitonin lysis buffer. The T cell antigen receptor (TCR)/CD3 multiprotein complex was immunoprecipitated with CML beads coupled with an anti-CD3ε Ab (clone APA1/1) specific for an intracellular (i.c.) epitope on the cytoplasmic tail. Flow cytometric analysis was subsequently performed. Identified by its Forward vs. Side Scatter profile, the homogeneous bead population is gated (top panel), and its fluorescence is displayed on a log-scale histogram (bottom panel). The histograms from several parallel samples are overlaid for comparison. The irrelevant Ig-PE control (anti-mouse CD11b) displayed low background staining (shaded gray histogram). The TCR αβ heterodimer was specifically co-immunoprecipitated in the predicted stoichiometric ratio: approximately 2-fold greater CD3ε (probe clone SK7, which binds an extracellular (e.c.) domain) was detected over TCRαβ (probe clone T10B9.1A-31). The mode fluorescence intensity (MoFI) was converted to the number of PE molecules (#PE) on the beads by following the instructions outlined in “Quantitative flow cytometry (qFCM)” (Support Protocol 1).

