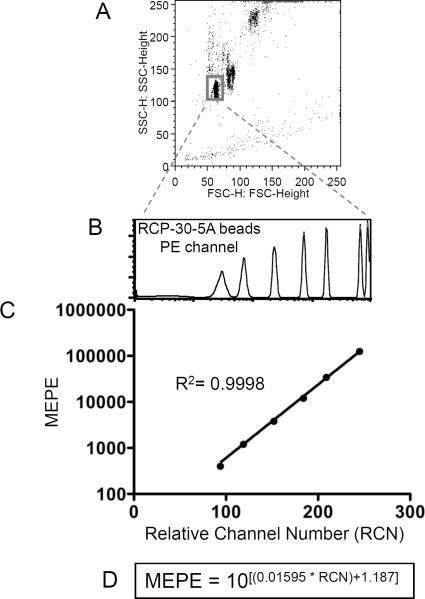
Figure 3.
The fluorescence standard curve for qFCM. This is an example of a PE calibration curve using RCP-30-5A beads from Spherotech, Inc.. (A) During data acquisition, the Forward Scatter amp gain and Side Scatter voltage are adjusted to get the beads on-scale. All other flow cytometry parameters and settings must remain identical to those used during the acquisition of experimental samples. For data analysis, a gate is drawn to restrict fluorescence analysis to that of singlet beads. (B) The series of unimodal fluorescence peaks in the histogram represent known numbers of mean equivalent soluble PE molecules (MEPE). By inputting the fluorescence intensities into the vendor-provided spreadsheet (not shown), experimental relative fluorescence values can be converted into numbers of PE molecules. (C) The standard curve and its equation can be generated manually, by plotting the RCP-30-5A relative fluorescence values against the number of PE molecules associated with each peak. (D) Various software programs can extrapolate an equation for the calibration curve, which can then be used to input experimental fluorescence data and solve for the number of PE molecules. The equation displayed here was calculated using Prism GraphPad.

