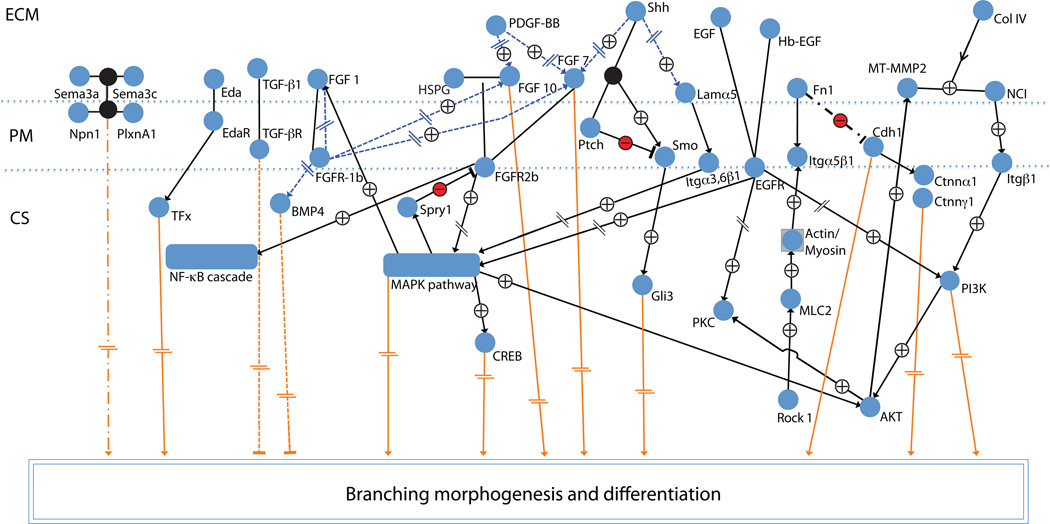
Figure 4. Cellular signaling map of embryonic salivary gland development.
A simplified overview of major signaling pathways known to control salivary gland development based on experimental studies. Slash dot slash: known effect, but pathway not identified/described yet; orange lines/arrows: pathways that affect morphogenesis/differentiation; plus sign: positive effect (activation); minus: negative effect (inhibition); interrupted lines: intermediate steps omitted; blue dotted lines and arrows: affect expression; open arrows: protein is modified (proteolysis); blunt line (inverted T): inhibition; and circular edge rectangles: signaling modules. See [66] for a detailed computational model of signaling pathways.

