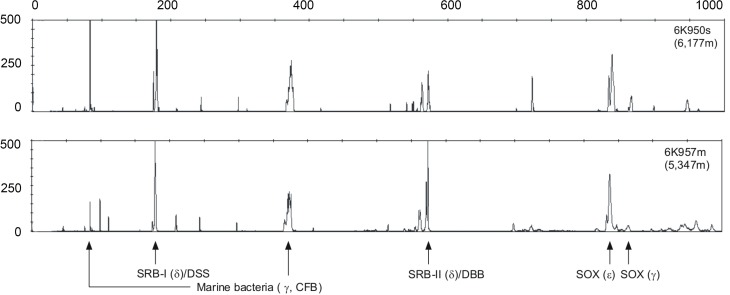
Figure 3.
Examples of bacterial T-RFLP electrophoretograms from Station 1 (upper profile) and Station 2 (lower profile). γ, δ and ε indicate the corresponding proteobacterial groups, and Sox and SRB indicate the sulfide oxidizing and sulfate reducing bacterial groups. The lengths of the fragments are displayed on the x-axis and relative fluorescence intensity of peaks is shown on the y-axis.

