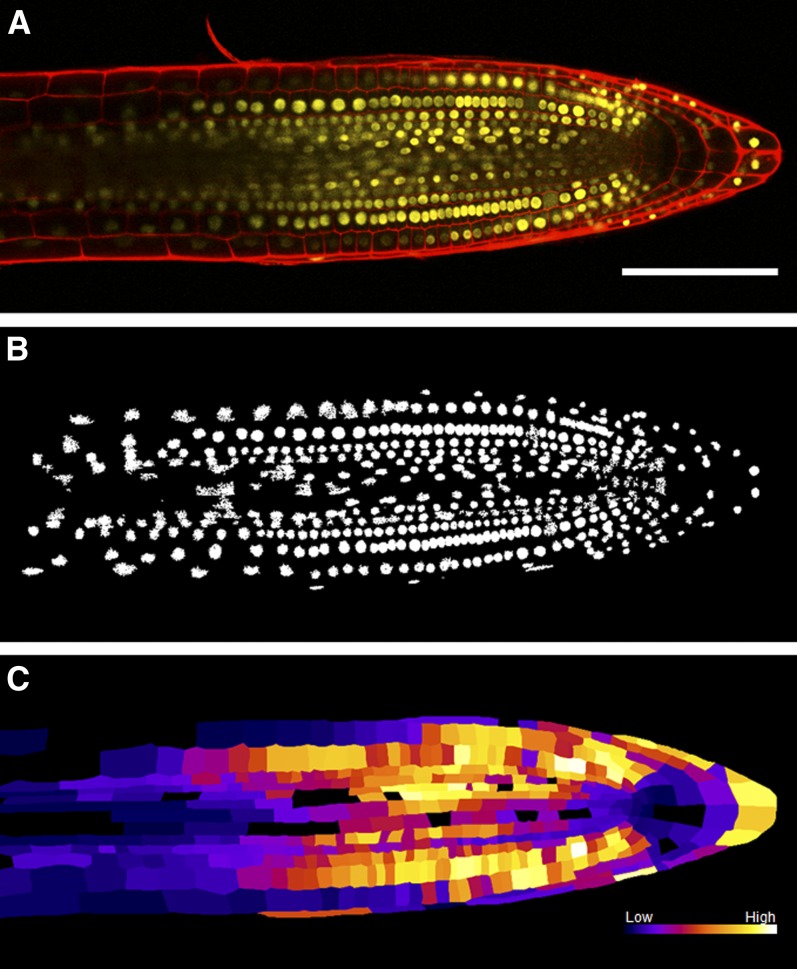
Figure 2.
Output of the CellSeT Nuclei Plug-in.
(A) The root previously segmented in Figure 1. Red channel: cell walls stained with propidium iodide. Yellow channel: DII-VENUS nuclear marker.
(B) Local Otsu thresholding of the nuclei followed by noise removal using a connected-component algorithm.
(C) A heat map generated using the intensities of each nucleus combined with cell geometry. Brighter colors represent higher levels of DII-VENUS detected in the nuclei of each cell. This reporter is inversely proportionate to the level of auxin; thus, darker regions represent cells containing a higher concentration of auxin (see also Supplemental Movie 2 online).
Bar in (A) = 100 μm.

