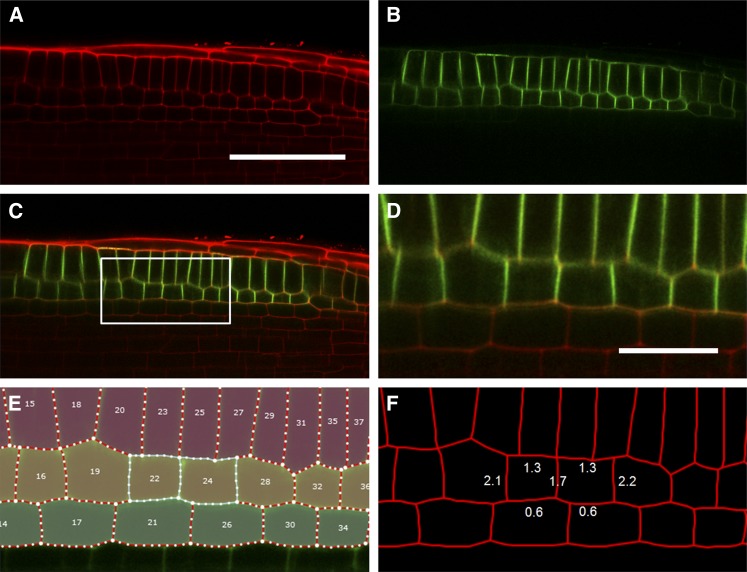
Figure 3.
Output of the CellSeT Fluorescence Plug-in.
(A) and (B) Confocal images used to evaluate the plug-in. Red channel: cell walls stained with propidium iodide. Green channel: PIN2-GFP.
(C) Merged image.
(D) A zoomed portion of the input image marked in (C).
(E) CellSeT cell map showing two selected cortical cells.
(F) Average normalized intensities for the cell walls of selected cortical cells expressing PIN2-GFP; fluorescence of the anticlinal walls is approximately twice that of periclinal walls.
Bar in (A) = 50 μm; bar in (D) = 15 μm.

