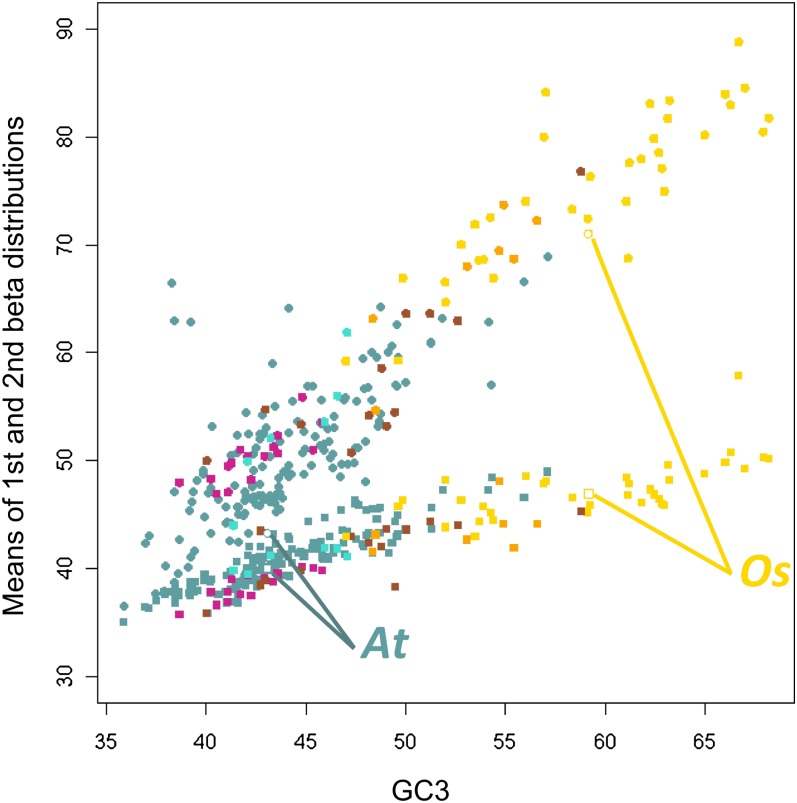
Figure 4.
Means of the Two Beta Distributions as a Function of Unbiased Mean GC3.
The scatterplot shows that the means of the two Beta distributions correlate positively with the mean GC3. Squares, mean of the first Beta distribution; circles, mean of the second Beta distribution. Violet red, gymnosperms; turquoise, basal angiosperms; brown, noncommelinid monocots; orange, non-Poaceae commelinids; gold, Poaceae; cadet blue, eudicots. At, Arabidopsis; Os, O. sativa.

