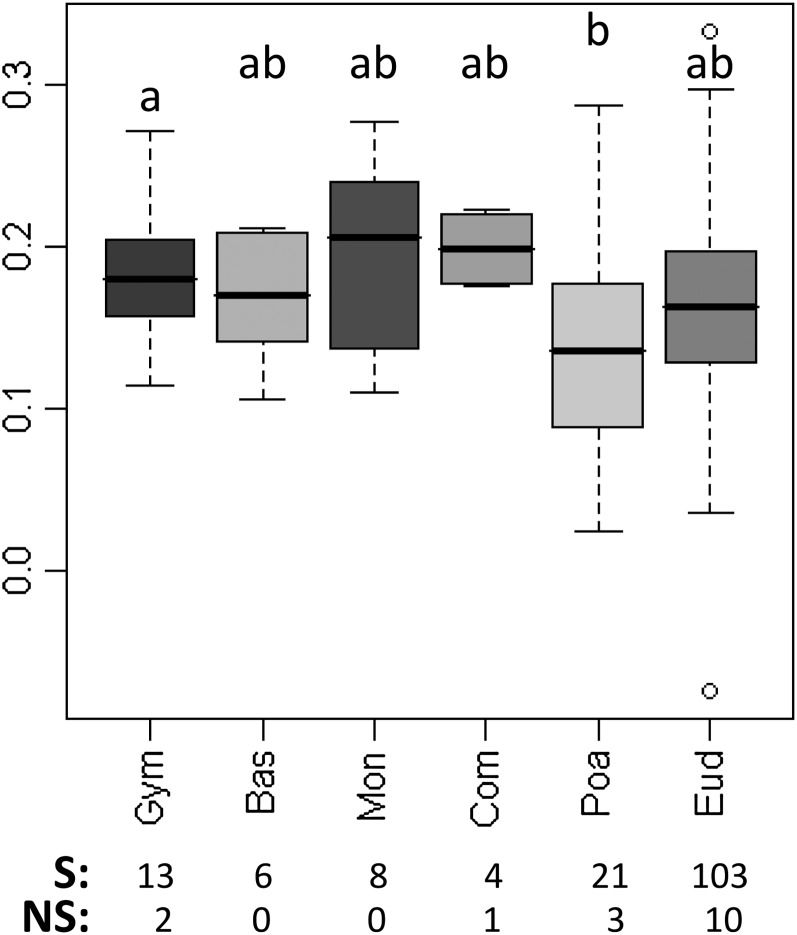
Figure 5.
Spearman’s Rho between GC3 and Expression Level.
The box plot shows that GC3 is positively correlated with expression level in most species, irrespective of their taxonomic group. Only species with significant correlation (Spearman’s test, P value ≤ 0.05) were plotted. On each box plot, the dark midline is the median, the bottom and top of the box are the lower and upper quartiles, respectively, and the ends of the whiskers are the lowest and highest data still within 1.5 times the interquartile range of the lower and higher quartiles, respectively. The number of species with significant correlation (S) and nonsignificant correlation (NS) is indicated below the graphs. Significant differences between groups according to Kruskal-Wallis tests are indicated with letters. Bas, basal angiosperms; Com, non-Poaceae commelinids; Eud, eudicots; Gym, gymnosperms; Mon, noncommelinid monocots; Poa, Poaceae.

