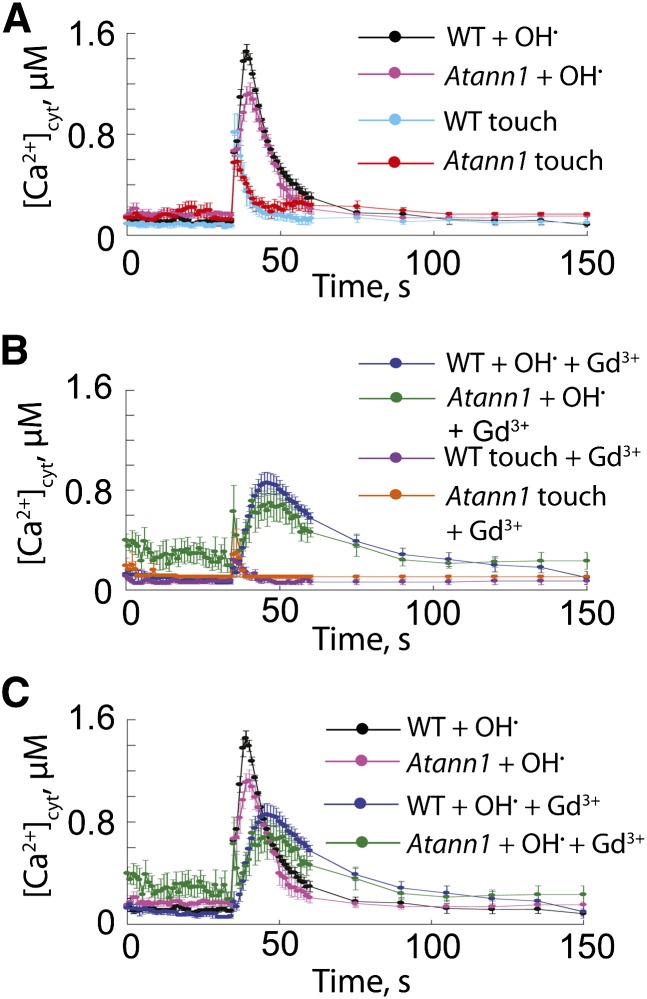
Figure 3.
OH•-Activated [Ca2+]cyt Increase in Root Epidermal Protoplasts Is Impaired in ann1.
(A) Root epidermal protoplast [Ca2+]cyt was measured with cytosolic aequorin. Control touch response (buffer only at 35 s) was similar in the wild type (WT) and ann1. OH• was generated by 0.5 mM Cu-Asc. Data are mean ± se (n = 4). Buffer comprised 10 mM CaCl2, 0.1 mM KCl, and 2 mM Tris/MES, pH 5.8, adjusted to 270 mOsM with d-sorbitol.
(B) As in (A) but protoplasts were incubated with 300 μM GdCl3 for 30 min prior to [Ca2+]cyt measurement (n = 3).
(C) Summary plot of experiments from (A) and (B) showing the effect of Gd3+ on OH•-induced [Ca2+]cyt responses of wild-type and ann1 protoplasts.

