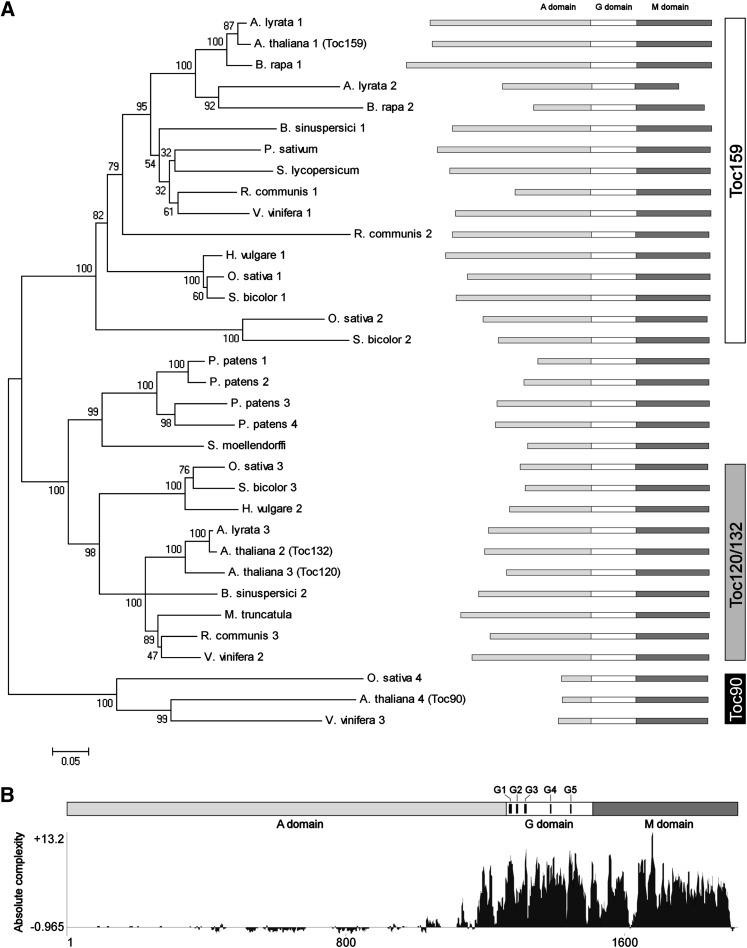
Figure 1.
Comparison of Deduced Amino Acid Sequences from Different Putative or Reported Toc159.
(A) A neighbor-joining tree of Toc159 homologs. The alignment used for this analysis is available as Supplemental Data Set 1 online. The bootstrap values with 2000 repetitions (%) are given at the respective nodes. The distance scale (substitutions per site) is shown in the bottom left corner.
(B) The absolute complexity plot of aligned Toc159 sequences. The absolute complexity indicates the average of pairwise alignment scores of each residue as computed using the AlignX module of Vector NTI Advance 10.3.0 (Invitrogen) with the substitution matrix blosum62mt2. A more positive value indicates a higher degree of conservation. The positions of the conserved motifs G1-G5 of the GTPase superfamily are indicated.

