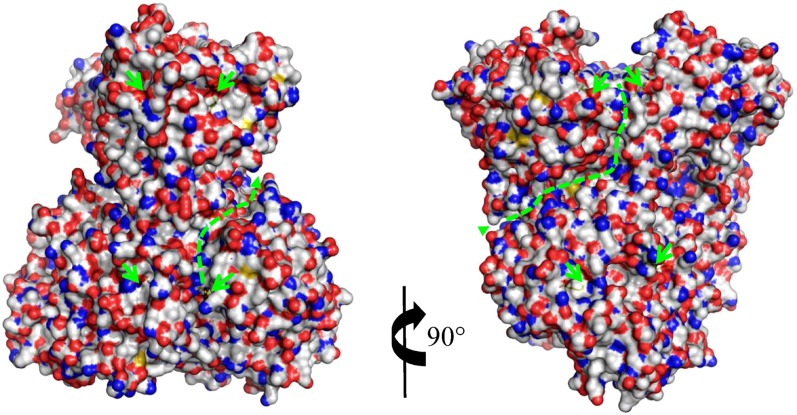
Figure 6.
Views of the Crevice at the Surface of mBIO3-BIO1 Going from DAPA-AT (BIO1) to DTBS (BIO3).
The two structures of mBIO3-BIO1 are shown after a rotation of 90° following a vertical axis. KAPA observed in the DAPA-AT and DTBS catalytic sites is drawn as a stick and marked by green arrows. The crevice is highlighted with a dashed line.

