Figure 3.
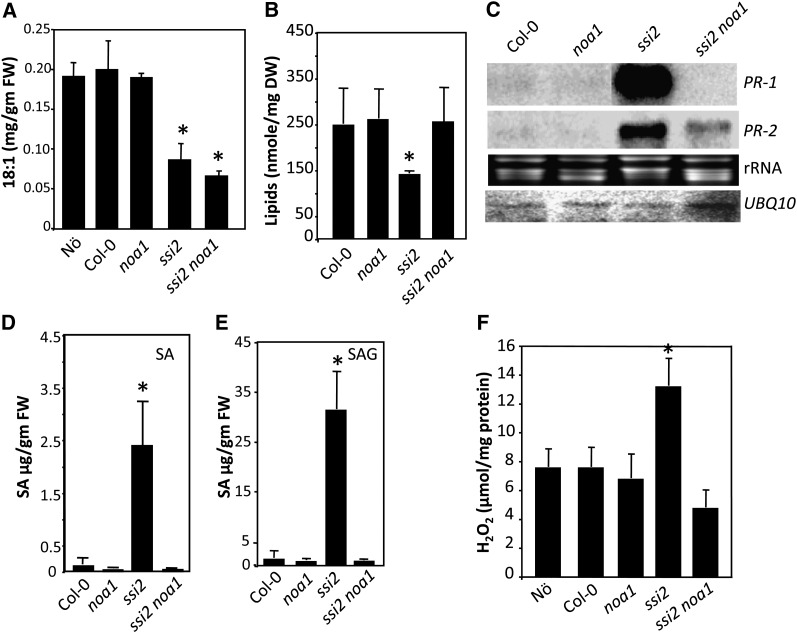
NOA1 Functions Downstream of 18:1.
(A) Levels of FAs in 4-week-old plants. The error bars represent sd (n = 6). Asterisks denote significant differences with wild-type plants (t test, P < 0.05). FW, fresh weight.
(B) Total lipid levels in indicated genotypes. The error bars represent sd (n = 5). Asterisks denote significant differences with wild-type plants (t test, P < 0.05). The experiment was repeated twice with similar results. DW, dry weight.
(C) RNA gel blot showing transcript levels of PR-1 and PR-2 genes. Ubiquitin mRNA (UBQ10) and ethidium bromide staining of rRNA were used as loading controls. This experiment was repeated four times with similar results.
(D) and (E) SA (D) and SA glucoside (E) levels in indicated genotypes. The error bars represent sd (n = 3). Asterisks denote significant differences with wild-type plants (t test, P < 0.05). The experiment was repeated twice with similar results.
(F) H2O2 levels in indicated genotypes. The error bars represent sd. Asterisks denote a significant difference from the wild type (t test, P < 0.05). H2O2 was quantified from the tissue extracts prepared as described in Methods. The experiment was repeated twice with similar results.

