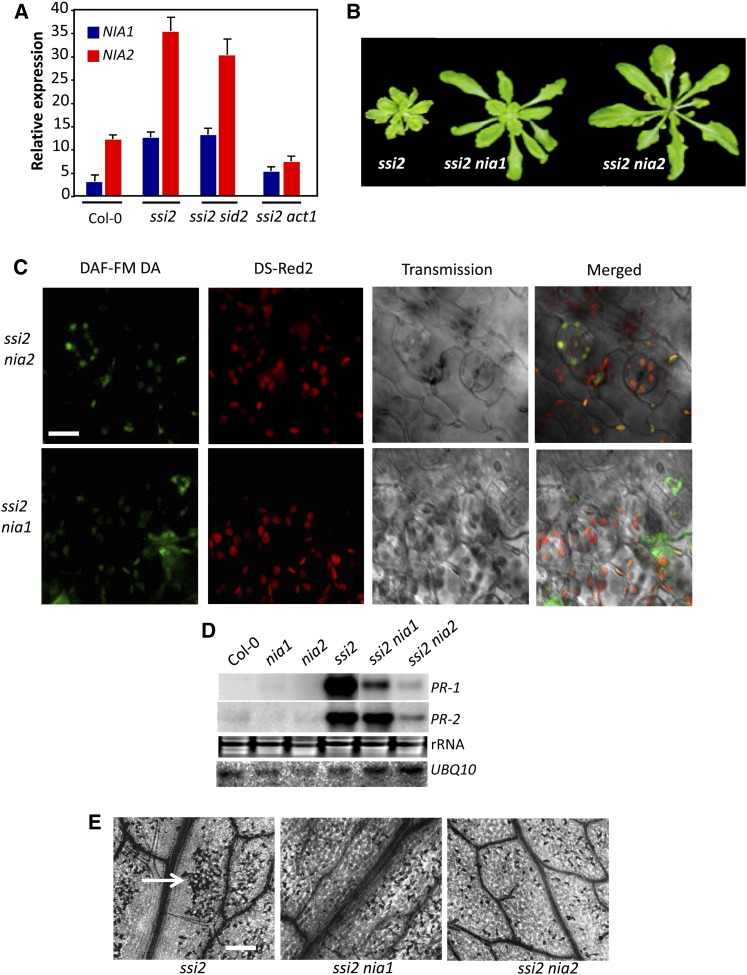
Figure 4.
NIA1 and NIA2 Contribute to NO Accumulation in ssi2 Plants.
(A) Real-time quantitative RT-PCR analysis showing relative levels of indicated genes. The experiment was repeated twice with similar results.
(B) Morphological phenotypes of 3-week-old plants.
(C) Confocal micrograph of DAF-FM DA–stained leaves showing subcellular location of NO in ssi2 nia1 and ssi2 nia2 plants (see Supplemental Figure 7B online). Chloroplast autofluorescence (red) was visualized using Ds-Red2 channel. Bar = 10 μm.
(D) RNA gel blot showing transcript levels of PR-1 and PR-2 genes. Ubiquitin mRNA (UBQ10) and ethidium bromide staining of rRNA were used as loading controls. The experiment was repeated three times with similar results.
(E) Microscopy of trypan blue stained leaves. Arrow indicates dead cells. At least six independent leaves were analyzed in two experiments with similar results. Bar = 270 μm.

