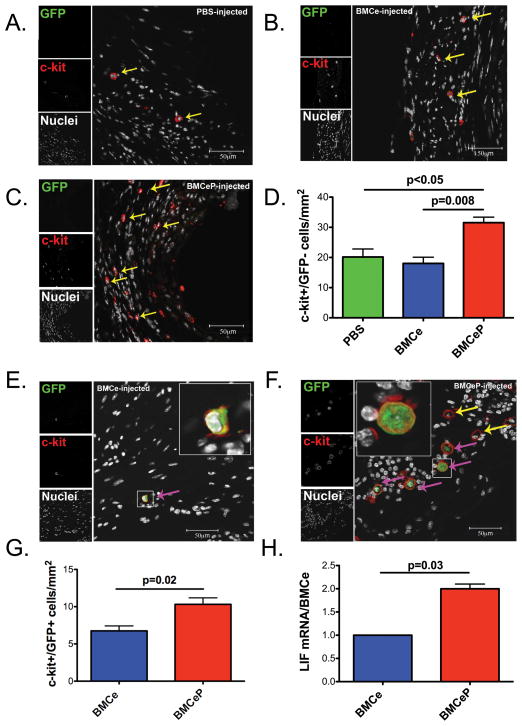
Figure 4. Increased recruitment and persistence of c-kit+ cells in BMCeP injected hearts.
C-kit+ cells (yellow arrows) in A. PBS, B. BMCe and C. BMCeP injected hearts. D. Quantitation of c-kit+/GFP− cells observed in the infarct. E. BMCe and F. BMCeP (pink arrows) transplanted cells. G. Quantitation of c-kit+/GFP+ cells in BMCe and BMCeP injected hearts. Graphs present number of positive cells normalized to the total area of the infarct (mm2), N=3 hearts per group. H. LIF mRNA in BMCe and BMCeP cells in vitro. Values are represented as fold change of relative cycle threshold. 18s mRNA was the internal control. Scale bars=50 μm.

