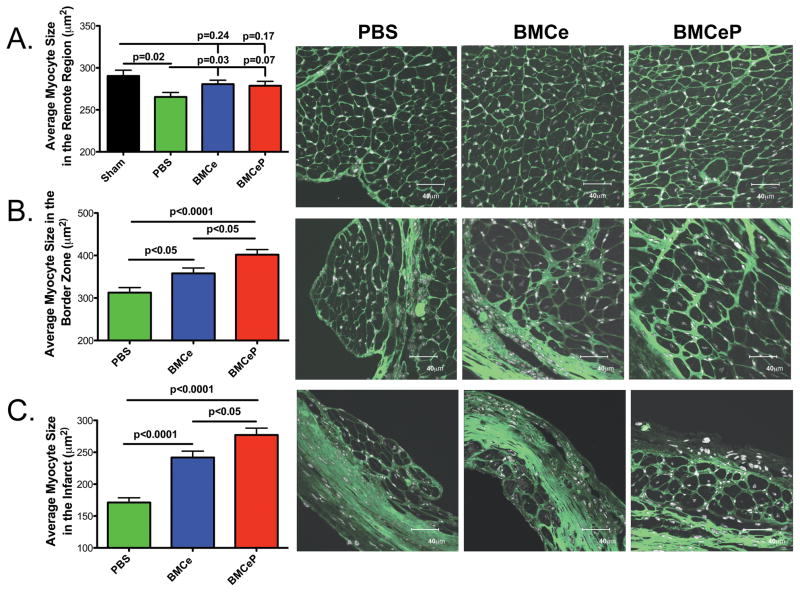
Figure 5. Cardiomyocyte size is increased in BMCeP hearts.
A. Average myocyte size in the remote region. B. Average myocyte size in the border zone of infarcted myocardium. C. Average myocyte size in the infarcted region. 150 cells were measured per group. Left, N=3 hearts per group for quantitation. Right, images of PBS, BMCe and BMCeP treated hearts. Myocyte size was visualized by wheat germ agglutinin-FITC (green). Scale bars=40 μm.

