Figure 6.

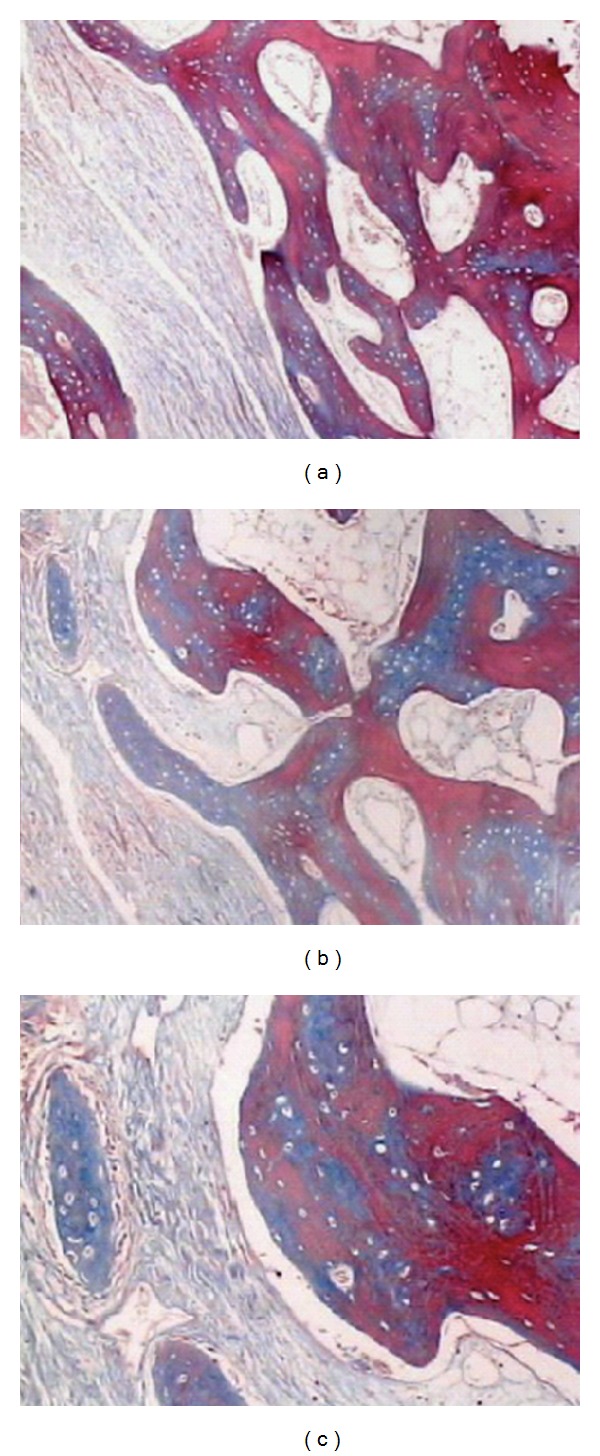
Images showing bone growth in different areas of the sample, with 40x magnification ((a)-(b)) and a 100x magnification (c). We can see the formation of fibers surrounding the “islands” of ossification. Masson's trichrome staining.

Images showing bone growth in different areas of the sample, with 40x magnification ((a)-(b)) and a 100x magnification (c). We can see the formation of fibers surrounding the “islands” of ossification. Masson's trichrome staining.