
Figure 1.
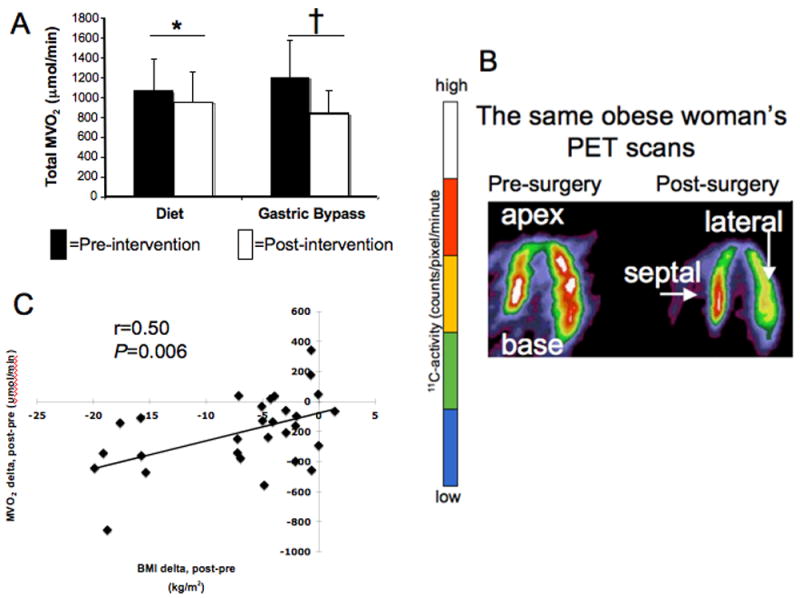
A. Total MVO2 decreased after diet and surgery (*P=0.02, †P=0.0006).
B. Typical positron emission tomography (PET)-derived myocardial images in the horizontal long-axis. The pre-surgery image (left) illustrates higher MVO2 (higher C-11 activity accumulation after 1-11C-acetate injection) than in the post-surgery image (right) in the same subject. The color scale graphically depicts C-11 activity: higher counts represented as white and red; lower counts (and lower MVO2) represented in blue and green.
C. Relation between MVO2 change and BMI change.