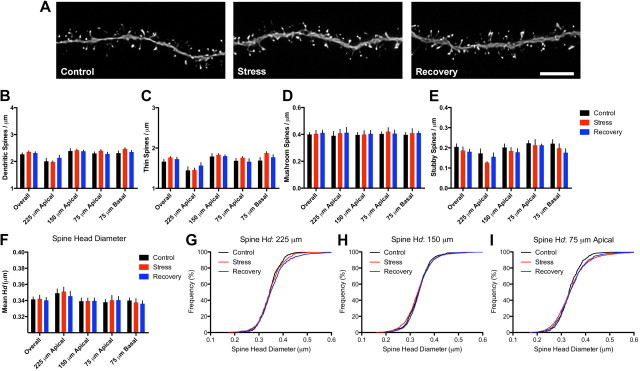
Figure 3.
Spine stability on middle-aged neurons. A, Representative dendritic segments from control (left), stress (center), and recovery (right) neurons from middle-aged animals. Scale bar, 5 μm. B, In contrast to neurons from young animals, stress exposure did not alter spine density in middle-aged neurons. C–F, Thin (C), mushroom (D), and stubby (E) spine densities and mean spine head diameters (F) were unaltered by stress or recovery. Bar graphs represent the group mean ± SEM. G, H, Individual head diameter (Hd) frequency distributions at 225 μm (G) from soma showed minor differences between control and recovery animals, whereas frequency distributions at 150 μm (H) were significantly different between stress and recovery animals. I, Spines at 75 μm in the apical tree were indistinguishable by group.

