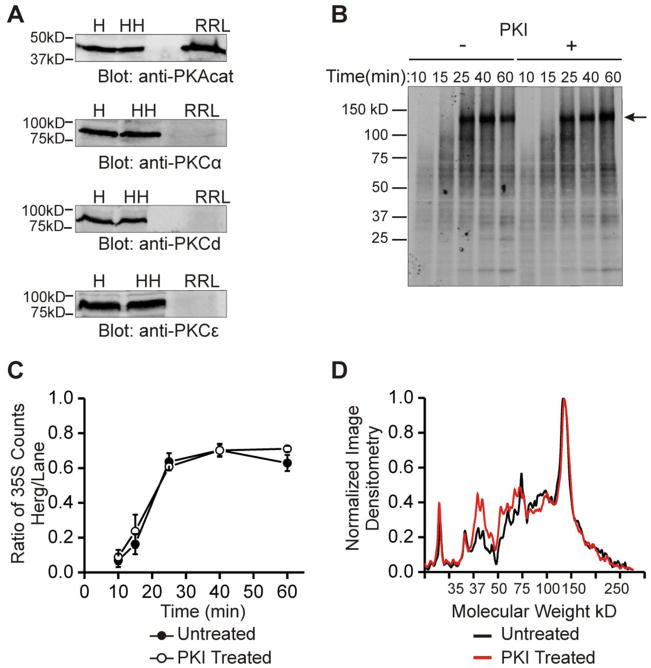
Figure 2. In vitro translation reveals that a cellular co-factor is necessary for changes in HERG protein abundance.
Part A shows immunoblots of PKA and PKC isoforms. Top blot shows PKA catalytic subunit is present in H = HEK293 lysate, HH = HEK-HERG lysate, and RRL = rabbit reticulocyte IVT lysate. Bottom three blots show PKC isoforms α, δ, and ε are present in HEK293 and HEK-HERG lysate but absent in rabbit reticulocyte lysate. Part B shows an 35S autoradiograph of labeled in-vitro translation products of HERG at five time points from 10 to 60 minutes and under the control condition (left half) or with addition of 10 μM PKI (right half). Arrow indicates full length HERG translation product at ~130 kD. Part C shows quantification and summary data of in-vitro translation experiments. The points graphed represent the ratio of 35S counts of the full length product over that of the total lane at each time point. The points of the control experiment and the experiment with PKI addition are not statistically different, n=3. Part D shows a line scan plot where normalized image densitometry of the 35S autoradiograph is plotted against increasing molecular weight. This analysis was done at 60 minutes of translation. Black line represents the control condition while red line represents the PKI treated condition. All plots were normalized to the value of the highest peak representing the full length HERG product and to zero for the baseline.

