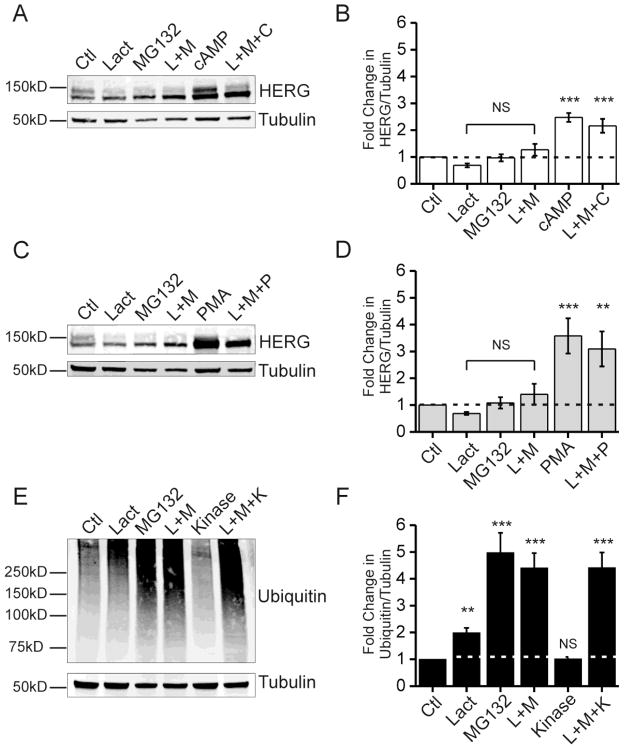
Figure 3. Proteasome inhibition does not mimic kinase stimulation.
Parts A, C, and E show immunoblots from HEK-HERG stable cells treated with proteasome inhibitors and kinase stimulators. Part A shows a Western blot with the effect of proteasome inhibitor treatments with lactacystin (Lact), MG132, and combination treatment (L+M) to CPT-cAMP treatment (cAMP) and a combination of proteasome inhibitors plus CPT-cAMP (L+M+C). HERG appears as a doublet and tubulin was used as a loading control. Part B shows quantification and summary data for part A. Fold change in the ratio of total HERG over tubulin is plotted per treatment condition. Control levels are normalized to 1.0 as indicated by dotted line. The differences between control and proteasome inhibition samples were not statistically significant. The differences between control samples and cAMP treated samples were statistically significant, n=5 *** p-value <0.001. Part C shows Western blots from HEK-HERG stable cells treated with proteasome inhibitors and PMA. Part D shows quantification and summary data for part C. Fold-change in the ratio of HERG over tubulin is plotted for each treatment condition. The differences between control and proteasome inhibition samples were not statistically significant. The differences between control samples and PMA treated samples were statistically significant, n=5 ** p-value <0.01 and *** p-value <0.001. Part E shows Western blots for total ubiquitin under control, proteasome inhibition, kinase stimulation, and combination treatments. Ubiquitin appears as a smear and tubulin was used as a loading control. Part F shows quantification and summary data for part E. Fold change in the ratio of ubiquitin over tubulin is plotted per treatment condition. Control levels were normalized to 1.0 as indicated by dotted line. The difference between control and kinase treated samples was not significant. The differences between control and proteasome inhibition samples were statistically significant, n=10 ** p-value <0.01 and *** p-value < 0.001.

