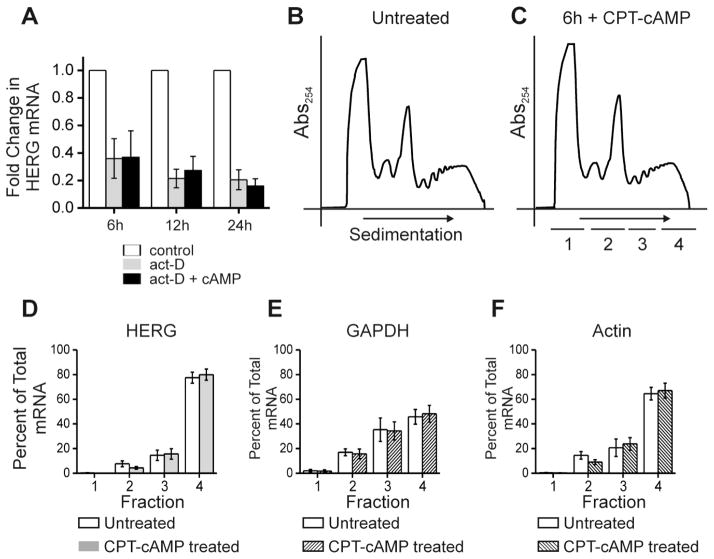
Figure 4. cAMP treatment does not alter HERG mRNA stability nor alter the association with polysomes.
Part A shows quantification of HERG mRNA levels (normalized to GAPDH mRNA levels) by quantitative real-time PCR for an experiment testing the stability of HERG mRNA after treatment with actinomycin-D alone (act-D) or in combination with CPT-cAMP (act-D +cAMP) over a time course. HERG mRNA levels were compared between the control condition (DMSO treated) and act-D or act-D + cAMP treatments at each of the three time points 6, 12 and 24 hours. Control sample fold change was normalized to 1.0, act-D treatment is shown in gray and act-D + cAMP treatment is shown in black. The differences between act-D and act-D + cAMP treatments were not statistically significant at any time point, n=3. Parts B and C show a separate experiment, they are polyribosomal profiles for untreated and 6-hour CPT-cAMP treated conditions. The y-axis shows absorbance at 254 nm plotted against increasing gradient density where heaviest components will sediment to the right. The underlined segments 1–4 show where fractions were collected for subsequent qRT-PCR. Parts D-F show summary data for results of qRT-PCR. The y-axis values represent percent of total RNA that is comprised by (D) HERG, (E) GAPDH, and (F) Actin, respectively per fraction. Open bars show the untreated condition while shaded bars show the cAMP treated condition. Differences between treated and untreated conditions were not significant, n=4.

