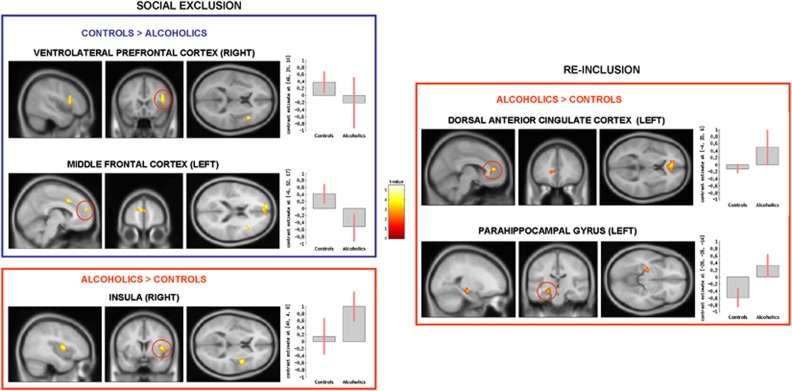
Figure 2.
Group comparison for social exclusion (explicit social exclusion (ESE)–implicit social exclusion (ISE), on the left) and re-inclusion (second inclusion (INCL2)–first inclusion (INCL1), on the right) contrasts, showing the brain areas presenting significantly reduced (in blue) or increased (in red) activations among alcohol-dependent participants (N=22) as compared with controls (N=22); p<0.05 corrected for multiple comparisons at cluster size. β-Values for each group in each brain area are presented in graphs on the right; error bars indicate standard deviations.

