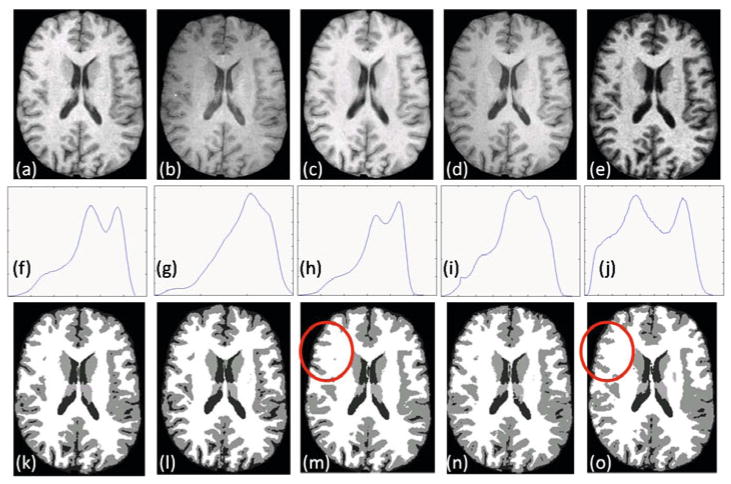
Fig. 4.
BIRN data: T1-w SPGR contrasts from (a) GE 1.5T, (b) GE 4T, (c) Philips 1.5T, (d) Siemens 3T scanner, (e) T1-w MPRAGE contrast from Siemens 1.5T. Their histograms are shown in (f)–(j) and the hard segmentations [1] are shown in (k)–(o). The histograms are quite different which is reflected on the difference in the segmentations.

