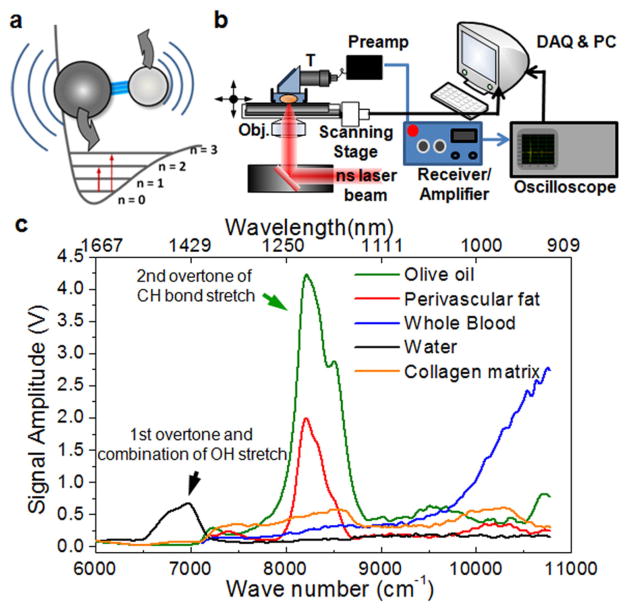
FIG. 1.
(color online). Photoacoustic detection of molecules based on overtone absorption. (a) Schematic diagram of the 1st and 2nd overtone absorption of a molecule. (b) VPA imaging on an inverted microscope. T, ultrasound transducer; gray (red) beam, ns laser. (c) VPA spectra of biological molecules and tissue components. The VPA signal amplitude is normalized to the laser energy at each wavelength. The VPA peak around 1200 nm contains the contribution from 2nd overtone of symmetric and asymmetric stretching modes of CH2. The 3rd overtone band of the CH stretching can be observed around 920–935 nm.

