
Figure 1. First-dimension (1D) separation of rat brain phospholipids by normal-phase HPLC-MS/MS.
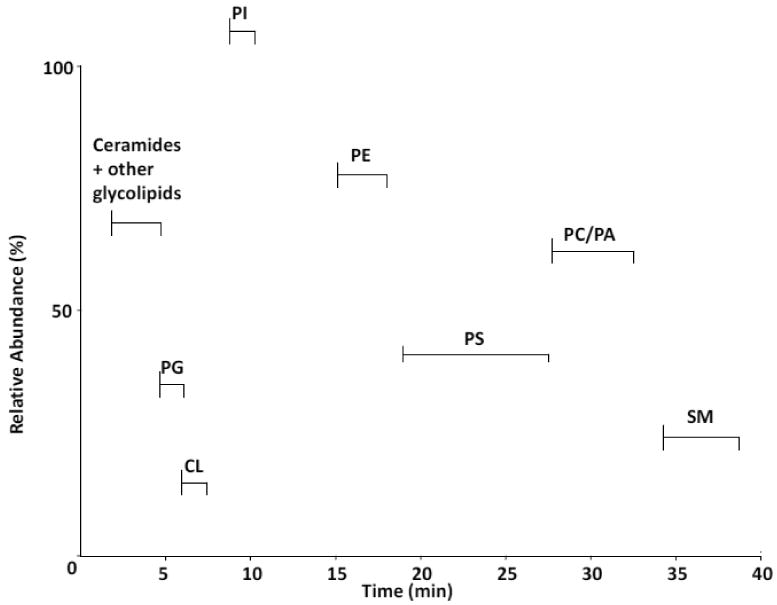
Lipids were extracted from rat brain tissue (non-mitochondrial enriched) and were subjected to 1D LC-MS analysis on a normal phase column. Individual lipids classes were identified based on retention times and MS/MS analyses. Major phospholipid and glycolipid fractions eluted in the following order; ceramide/glycolipids, PG, CL, PI, PE, PS, PC/PA, SPH as indicated. A base peak intensity plot is shown.