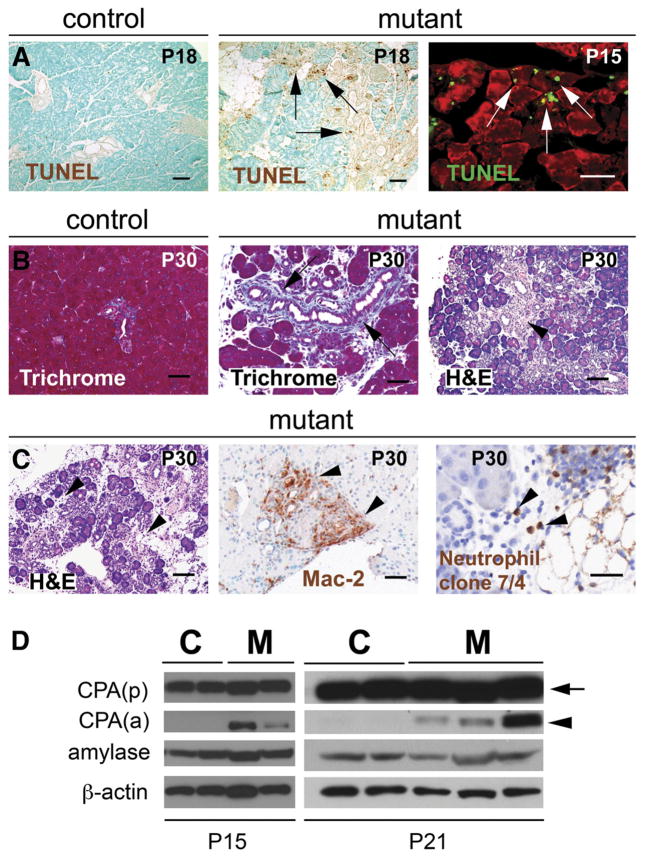
Figure 6.
Prox1ΔPanc pancreata have features indicative of tissue damage. (A) Results of TUNEL assay show apoptotic acinar cells (arrows) in P15–P18 Prox1ΔPanc pancreata but not in control tissues. Other tissue damage features observed in P30 Prox1ΔPanc pancreata but not in control pancreata include periductal fibrosis (B, center, arrows; trichrome staining), increased stromal cells (B, H&E staining, arrowhead), immune infiltrates (C, H&E staining, arrowheads), macrophage (C, center, arrowheads; anti–Mac-2 staining) and neutrophil infiltrates (C, right, arrowheads; anti-neutrophil clone 7/4 staining), and intrapancreatic activation of CPA (D). (D) Results of Western blot analysis of total protein from individual control (C) or Prox1ΔPanc (M) pancreata dissected at P15 or P21. CPA(p) (arrow) and CPA(a) (arrowhead) indicate the precursor or active forms of CPA, respectively. Scale bars = 50 μm (A, right; B, left and center; C, center and right) and 100 μm (A, left and center; B, right; C, left).

