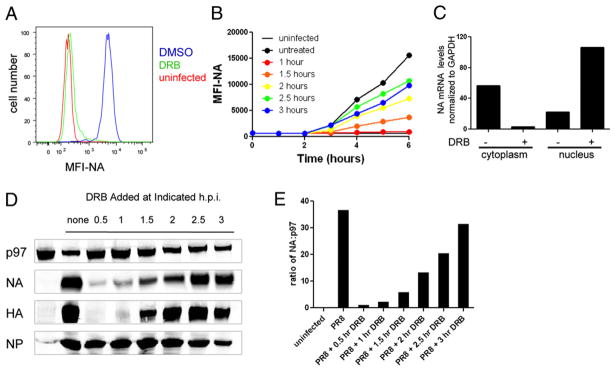
FIGURE 1.
Influenza NA expression is inhibited by DRB treatment. A, L-Kb cells were infected with insOVA for 30 min and then cultured for 1 h before the addition of DRB. After five additional hours in culture, cells were analyzed for cell-surface NA expression by flow cytometry. B, Cells were infected as in A, and DRB was added to infected cells at the indicated times. Cells were collected every hour and stored at 4°C until the completion of the experiment and analyzed for cell surface NA. The mean fluorescence intensity (MFI) of the cell population is reported on the y-axis. C, mRNA from cytosolic and nuclear cell fractions was subjected to reverse transcription, followed by real-time PCR. Levels of NA mRNA in each sample were normalized to GAPDH mRNA levels to control for differences in sample recovery. D, Cells were infected and treated with DRB at the indicated times. Six hours p.i., total-cell lysates were prepared and analyzed by SDS-PAGE and Western blot analysis for NA, HA, NP, and cellular p97. E, The relative amount of NA present in cells is plotted for each DRB treatment.

