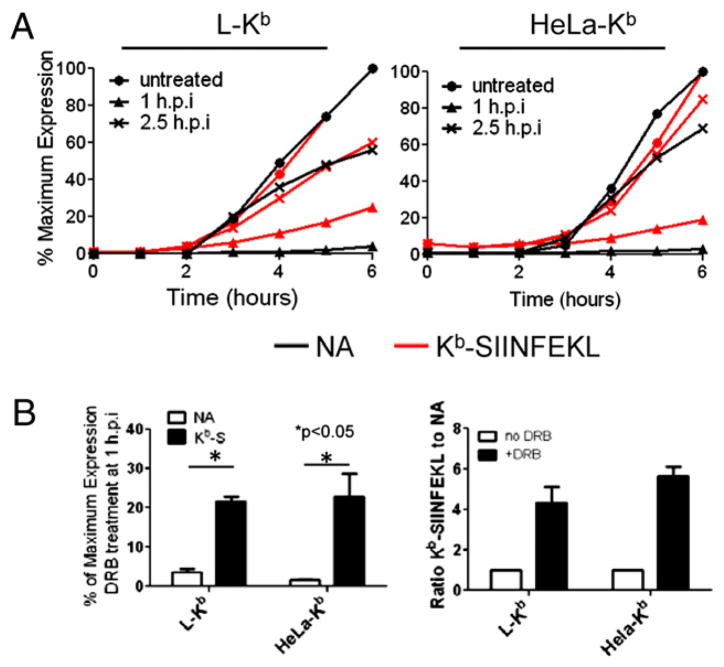
FIGURE 3.
DRB-insensitive Ag presentation is dependent on the timing of treatment. A, L-Kb and HeLa-Kb cells were infected and cultured as in Fig. 1. DRB was added 1 or 2.5 h p.i. At indicated times, cells were collected and analyzed by flow cytometry for cell-surface NA (black trace) and Kb-SIINFEKL (red trace), and the relative amounts of each cell-surface molecule was plotted as a percentage of maximum expression (obtained from untreated cells at 6 h p.i). B, At 6 h p.i., the amount of cell-surface NA and Kb-SIINFEKL (Kb-S) on infected cells treated with DRB 1 h p.i was determined on L-Kb and HeLa-Kb cells and plotted as the percentage of the maximum level obtained in untreated cells. The relative ratio of Kb-SIINFEKL/NA for DRB-treated cells was compared with untreated cells and plotted for each cell type.

