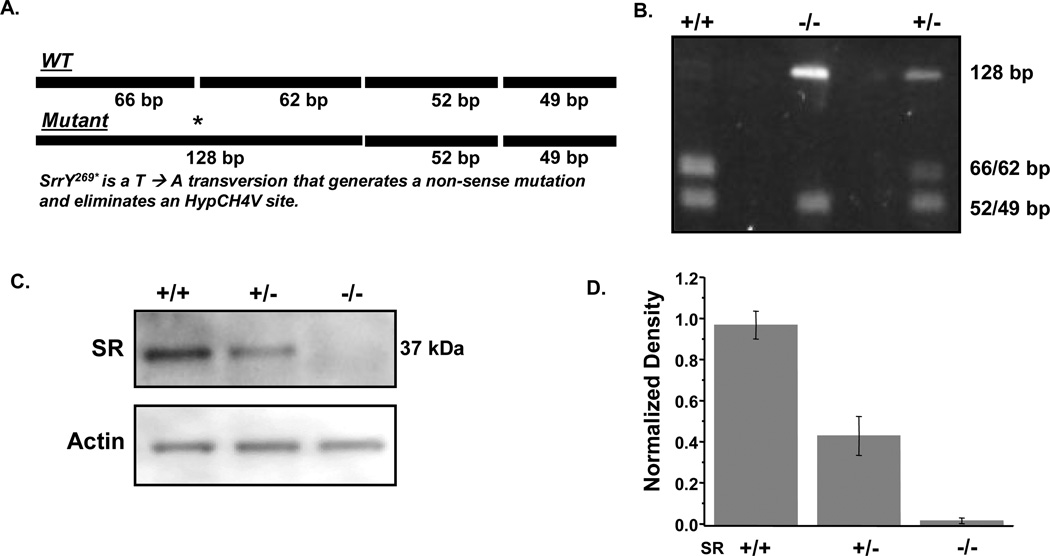
Fig. 1. SR genotype determination and the expression of SR and hSOD1 in mouse spinal cords.
(a) Schematic representation of the PCR-amplified portion of the mouse Srr gene. Digestion with the restriction enzyme HpyCH4V produces fragments that are 49, 52, 62, and 66 base pairs. The SrrY269* (T-->A) mutation eliminated the first HpyCH4V recognition site resulting in three fragments of 49, 52, and 128 base pairs. (b) Representative agarose gel analysis containing HpyCH4V-digested DNA from wild-type (+/+, lane 1), homozygous mutant (−/−, lane 2) and heterozygous mutant (+/−, lane 3) mice. The 49 and 52 bp fragments appear as a single band, as do the 62 and 66 bp fragments. (c) Representative western blot of SR and actin expression in G93A mouse spinal cord extracts. (d) Densitometric analysis of SR expression from (c) in spinal cords of SR mutant G93A mice. Bars represent mean % integrated density value (IDV, see Methods for further detail).

