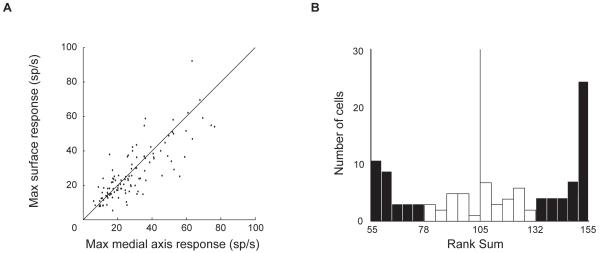
Figure 3.
Response strength comparison for medial axis and surface stimuli. (A) Scatter plot of mean response across top ten stimuli in each domain (n=111). (B) Histogram of Wilcoxon rank sum statistics testing whether responses to top ten medial axis stimuli were higher than responses to top ten surface stimuli. Filled bars indicate significantly (p < 0.05) higher medial axis responses (right, n = 40) or higher surface responses (left, n = 29).

