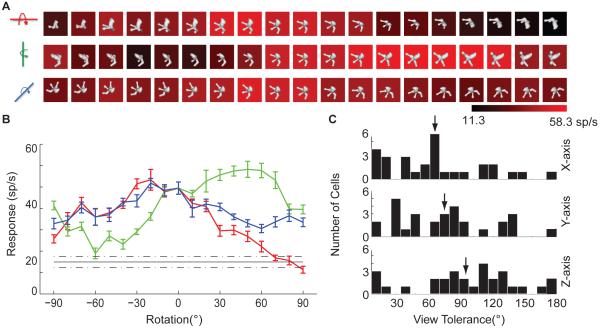
Figure 8.
3D rotation test. (A) Example results, for the Figure 1 neuron. Average response level (see scale bar) was measured for versions of the highest response stimulus from the adaptive sampling procedure rotated across a 180° range in 10° increments around the x (top), y (middle), and z (bottom) axes. (B) Same data as in (A), for rotation around the x (red), y (green), and z (blue) axes (error bars indicate +/- s.e.m.), compared to average response across all stimuli in the main experiment (black, dashed lines indicate +/- s.e.m.). (C) Distribution of tolerances for rotation around the x (top), y (middle), and z (bottom) axes. Tolerance was defined as the width in degrees of the range over which responses to the highest response stimulus remained significantly (t test, p < 0.05) greater than the average response to random stimuli tested as part of the adaptive sampling experiment.

