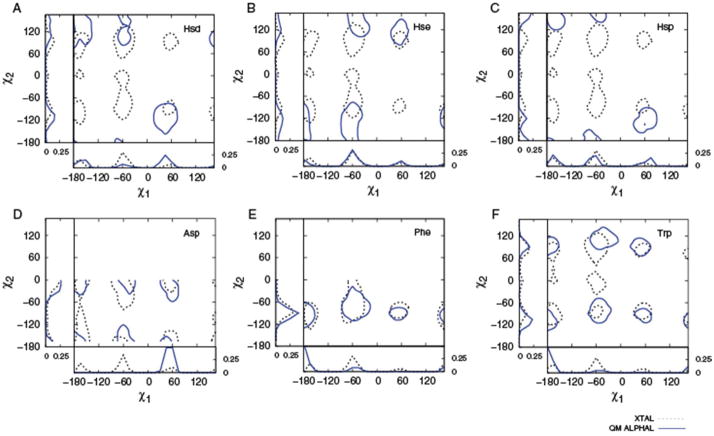
Figure 6.
Combined QM/PDB survey probability plots for A) Hsd, B) Hse, C) Hsp, D) Asp, E) Phe, and F) Trp. QM (solid) and crystallographic survey (dashed) probabilities are shown. Probability contour lines are of 0.005. See Supporting Information for backbone-dependent plots.

