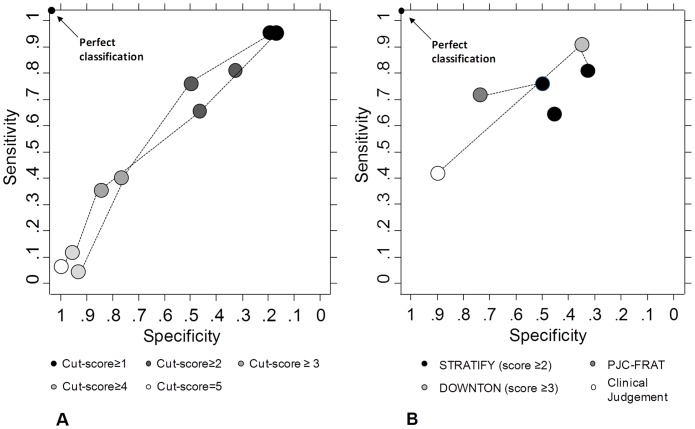
Figure 2. ROC space showing sensitivity and specificity of the STRATIFY tool per study for different cut-scores.
(A), and for fall prediction based on clinical judgment and on the optimal cut-off score of STRATIFY, DOWNTON and PJC-FRAT (B). Estimates originated from the same studies are connected with dashed lines. Estimates closer to the top left corner have better sensitivity-specificity.

