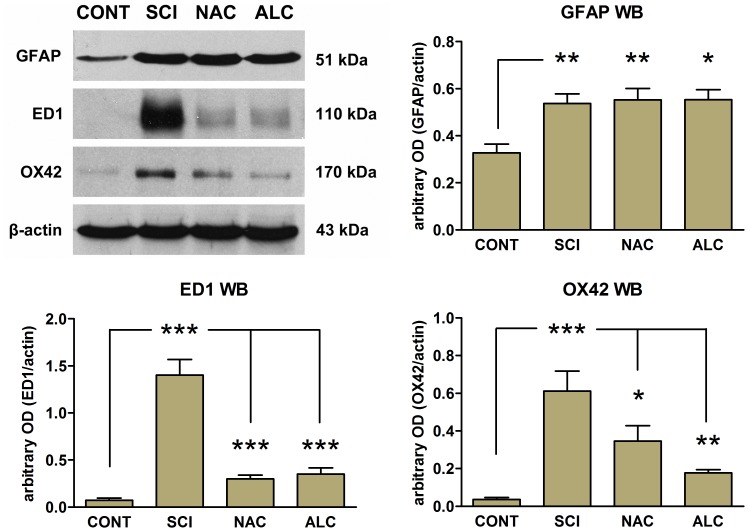
Figure 5. Representative Western blots for GFAP, ED1 and OX42 expression in L4–L5 spinal cord segments.
Protein was prepared from healthy uninjured control rats (CONT) or rats subjected to L5 spinal cord injury in the absence (SCI) or presence of N-acetyl cysteine (NAC) or acetyl-L-carnitine (ALC) treatment. Histograms show the mean optical density (OD) for each band expressed relative to the corresponding β-actin levels for each sample, for a total of 4 animals per group. Error bars show S.E.M. P<0.05 is indicated by*, P<0.01 is indicated by**and P<0.001 is indicated by***(CONT vs. SCI, NAC, ALC for GFAP; SCI vs, CONT, NAC, ALC for ED1 and OX42).

