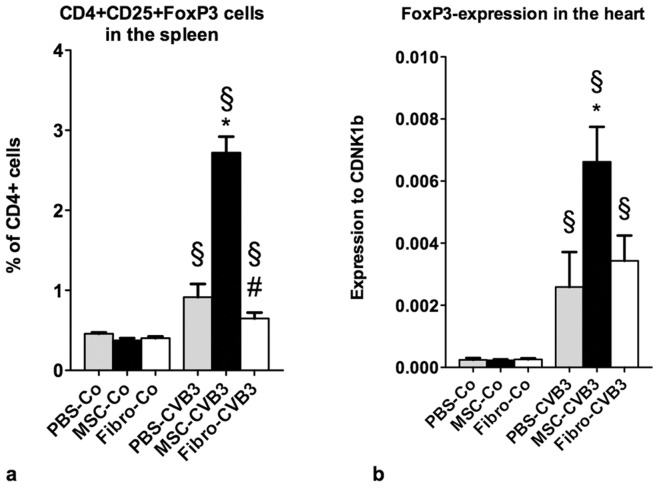
Figure 4. Flow cytometric analysis of naïve CD4+CD25+FoxP3 T cells in the spleen.
(a) and expression of the FoxP3 transcription factor in the myocardium (b). a. Administration of MSCs induced a significant upregulation of naïve regulatory T cells in the spleen compared to PBS and fibroblasts. b. Expression of the transcription factor FoxP3 in the myocardium was analyzed as an indirect marker for the number of FoxP3-positive regulatory T cells in the heart. Higher expression of FoxP3 in the MSC-treated mice implies a signifcantly higher number of naïve regulatory T cells in the heart compared to PBS- and fibroblast-treated mice. *p<0.05 vs PBS-CVB3, § p<0.05 vs respective control-group, # p<0.05 vs. MSC-CVB3.

