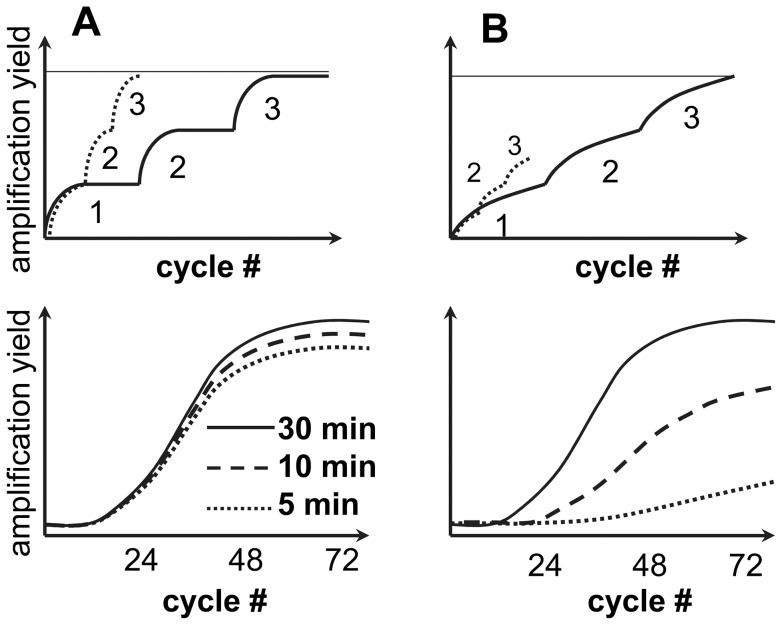
Figure 1. Experimental design for analysis of PrPSc elongation rate.
Schematic representation of kinetics of PrPSc amplification within individual PMCAb cycles (top panels, three cycles are shown for simplicity) or within individual PMCAb rounds as a function of cycle number (bottom panels) for a strain with fast elongation rate (A) or slow elongation rate (B). The length of incubation intervals between the sonication cycles are 30 min (solid lines), 10 min (dashed lines) or 5 min (dotted lines). For a strain with a fast elongation rate, the amplification is equally effective regardless of the length of incubation intervals (A); whereas for a strain with slow elongation rate, shortening of incubation intervals leads to less effective amplification (B).

