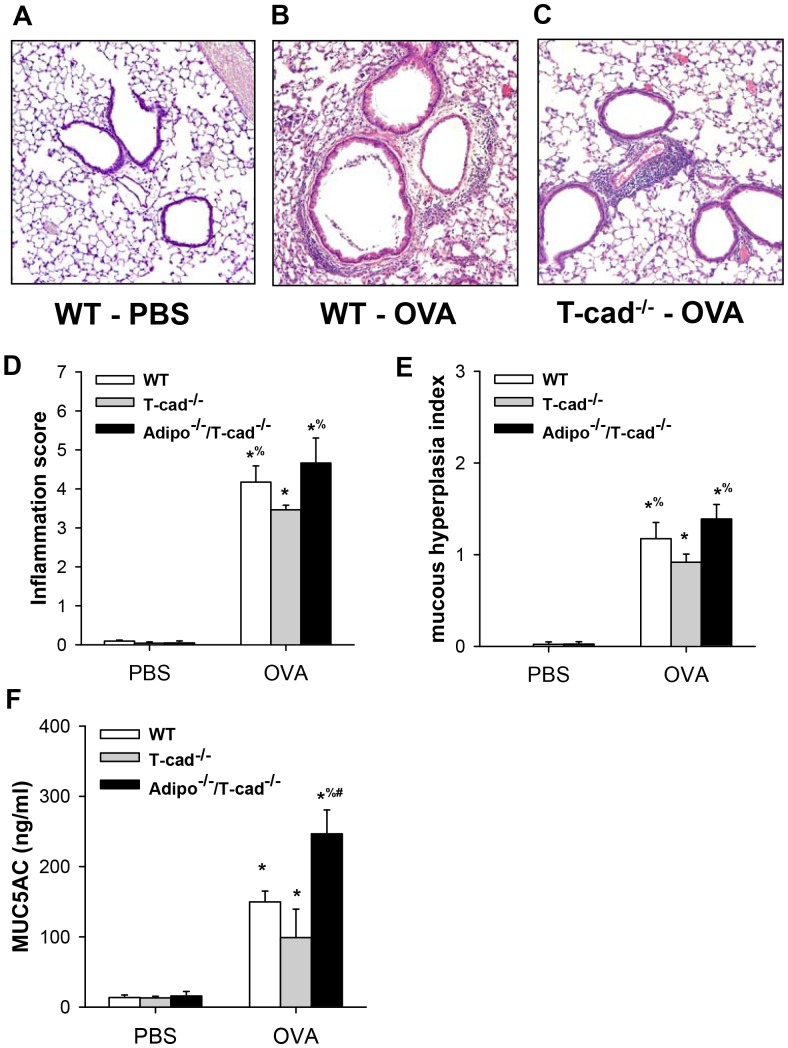
Figure 5. Histological assessment of inflammation and mucous cell hyperplasia.
H&E stained sections of PBS-challenged WT (A), 6% OVA-challenged WT (B) and 6% OVA-challenged T-cad−/− mice (C). Inflammation index for airways (D), mucous hyperplasia index (E), and BAL MUC5AC (F). Results are mean±SEM of 3–5 mice per group in the PBS treated groups and 5–6 mice per group in the OVA treated groups. *p<0.05 vs genotype-matched PBS-challenged mice; % p<0.05 vs exposure-matched T-cad−/− mice; #p<0.05, vs OVA-challenged WT.

