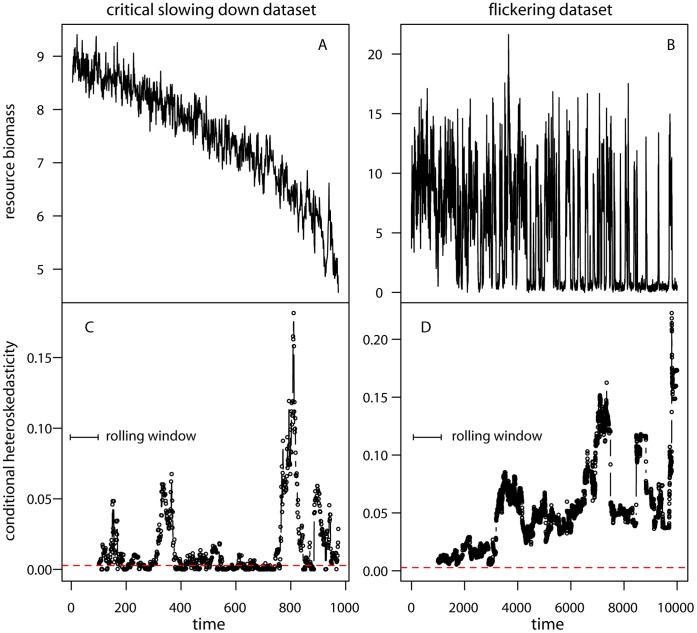
Figure 4. Conditional heteroskedasticity estimated on the critical slowing down and flickering datasets.
(A, B) Time series of the state variable. (C, D) CH estimated within rolling windows of 10% the size of the original time series. CH was applied to the residuals of the best fit AR(p) on the original datasets. Values of CH above the dashed red line are significant (P = 0.1).

