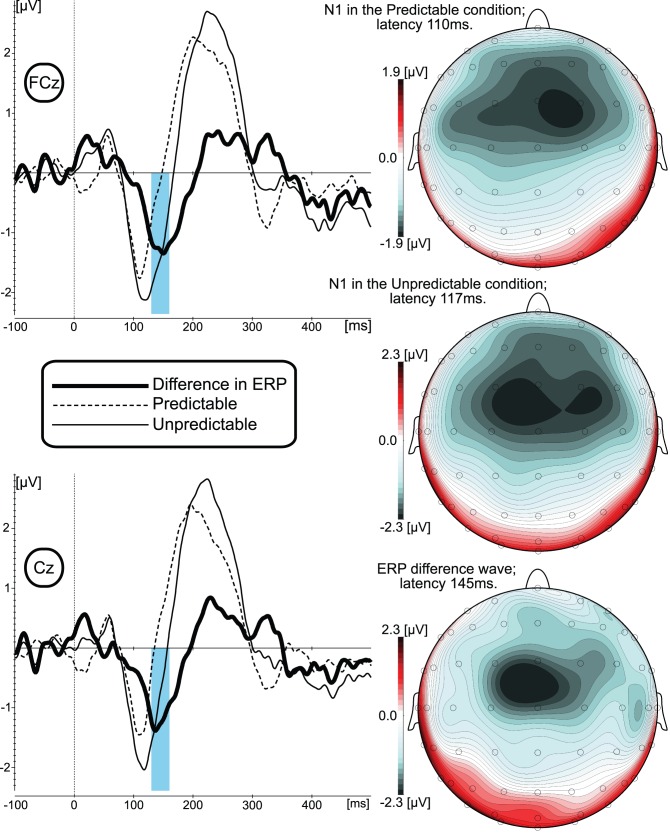
Figure 2. Grand-averaged ERP waveforms and ERP scalp distribution results elicited by the Up shift of the F0.
Left panel represents ERPs elicited in predictable and unpredictable experimental conditions measured at two electrode sites that were submitted for statistical analyses. Blue vertical bar depicts time window at which the mean amplitude of the ERP difference wave was measured for the statistical analyses. Right panel represents scalp distribution of N1 response in predictable (top) and unpredictable (middle) experimental conditions as well as the scalp distribution of the ERP difference wave (bottom).

