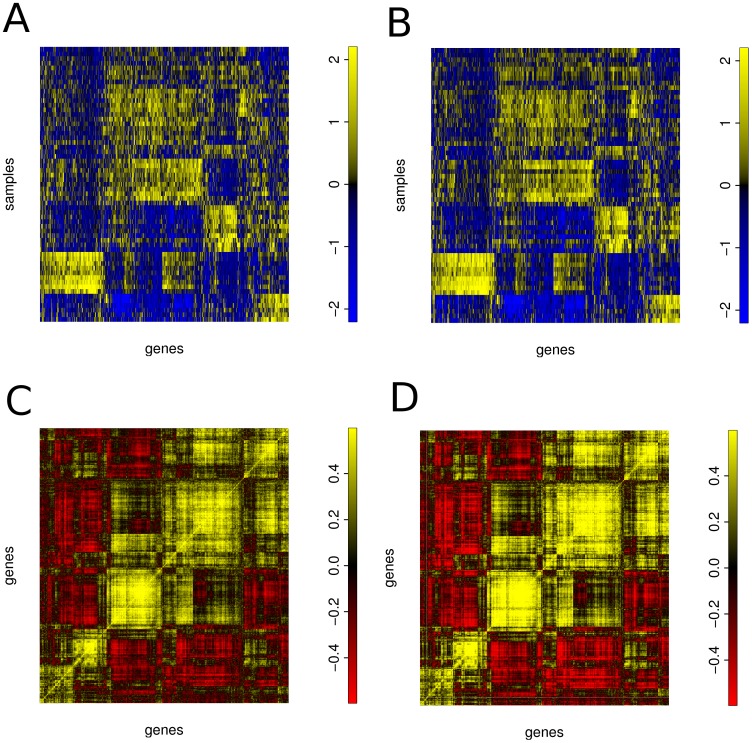
Figure 1. Gene expression can be predicted from miRNA expression with high accuracy.
A) Gene expression values. B) Gene expression values predicted from miRNA expression. C) Correlation of gene expression values. D) Correlation of predicted gene expression values. Besides the gene expression structure, the correlation structure is well-preserved. Predictions are from unconstrained gene models. In subfigures A and B, samples are in rows and genes are in columns. Expression values were centered and scaled and color-coded with blue representing low and yellow high expression values. The subfigures C and D show the gene-by-gene correlation structure of the genes displayed in subfigures A and B. Here, yellow indicates high correlation and red indicates anti-correlation of genes. The order of genes and samples is the same for all subfigures.

