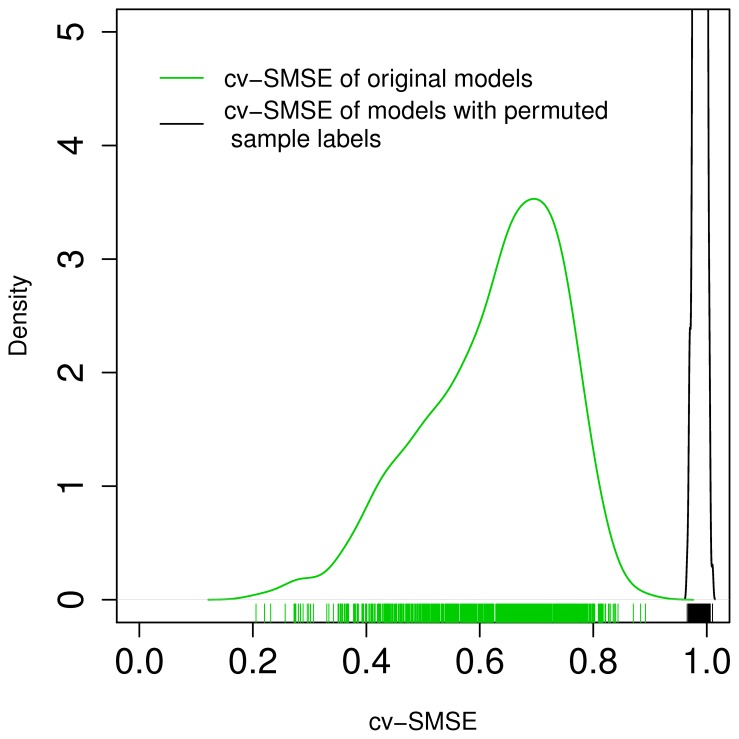
Figure 2. Scaled mean squared cross-validated prediction error (cv-SMSE) of unconstrained models with correct sample lables (green) and of models with permuted sample labels (black).
The range of the cv-SMSE is shown on the horizontal axis, while the density is shown on the vertical axis. The lines indicate the density of the data distributions, and small vertical stripes display individual data points.

