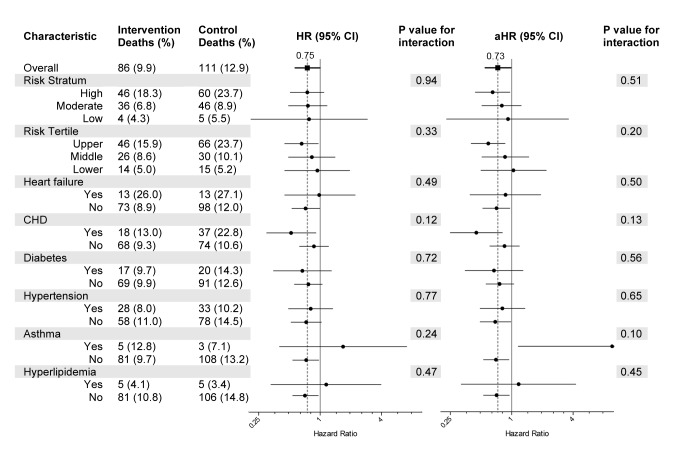
Figure 2. Subgroup analyses.
Deaths and tests for interaction by subgroup. HRs and adjusted HRs (aHR) along with 95% CIs are represented by forest plots with x-axis in log 2 scale. The regression model used for the aHR includes covariates for sex, age group, primary diagnosis, perceived health rating, number of medications taken, hospital stays in the past 6 mo, and tobacco use. CHD, coronary heart disease.

