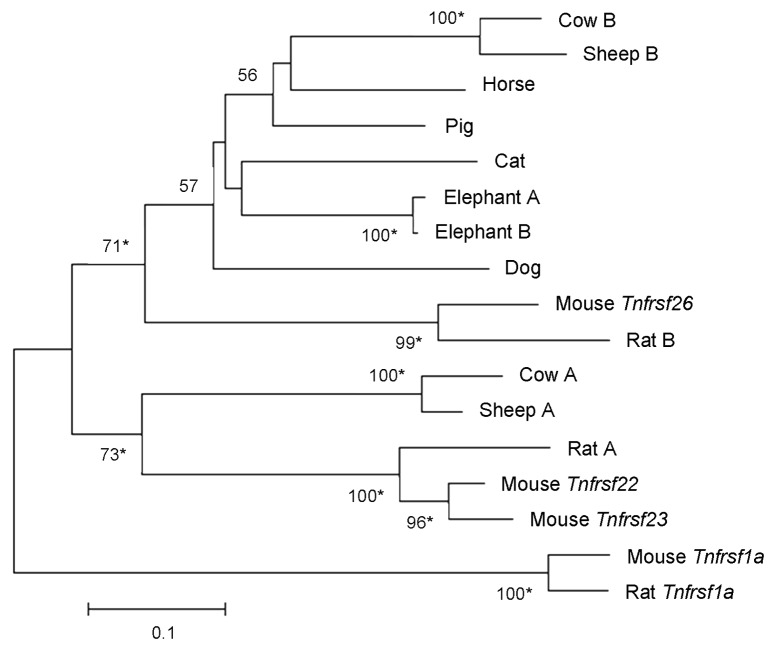
Figure 7. Phylogeny of Tnfrsf homologous sequences within Kcnq1 orthologous regions of placental mammals. The phylogeny was based on the Neighbor-Joining analysis of nucleotide sequences. Analysis was restricted to placental mammalian sequences that aligned unambiguously to mouse Tnfrsf22, Tnfrsf23 or Tnfrsf26, with the exception of human (due to the small size of the orthologous sequences) and guinea pig (see Materials and Methods). This rooted phylogram was obtained using the Maximum Composite Likelihood method implemented in MEGA 5.05.13 The tree is drawn at a scale that represents the number of base substitutions per site. Numbers at nodes represent bootstrap support values based on 5000 pseudoreplicates. Values below 50% were removed and * indicates 70% or above bootstrap support.16

An official website of the United States government
Here's how you know
Official websites use .gov
A
.gov website belongs to an official
government organization in the United States.
Secure .gov websites use HTTPS
A lock (
) or https:// means you've safely
connected to the .gov website. Share sensitive
information only on official, secure websites.
