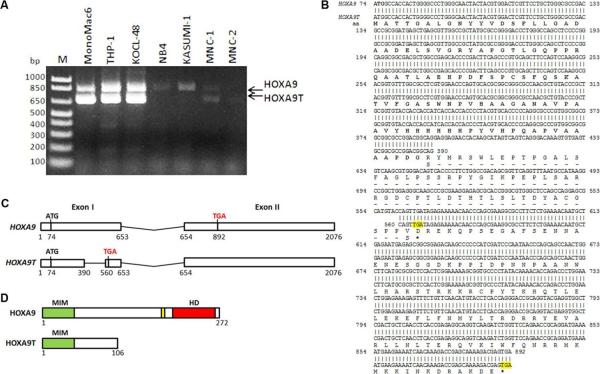
Figure 1. HOXA9 expression in leukemia cell lines, sequence and the schematic structures.
(A) Two transcripts of HOXA9 were detected in normal human bone marrow mononuclear cells (MNC) and leukemia cell lines including MONOMAC6 /t(9;11), KOCL-48 /t(4;11), THP-1 /t(9;11), NB-4/t(15;17) and KASUMI-1/t(8;21) by RT-PCR. (B) Alignment of the sequence of two isoforms of HOXA9. RT-PCR product of the two transcripts from MONOMAC6, KOCL-48, and THP-1 was sequenced after gel recovery. The sequences of HOXA9 (upper row) and HOXA9T (lower row) were aligned. The stop codes were highlighted. Amino acid (aa) sequence was also showed below the nucleotide sequence. The common amino acid sequence between HOXA9 and HOXA9T were shown in boldface. Asterisks indicate stop codons. (C) Schematic of gene structure of human HOXA9 and HOXA9T. The exons (exon I and exon II) are represented with white boxes. The nucleotide locations are indicated below the exons. Initiation (ATG) and stop codons (TGA) are also shown. (D) Schematic of protein structure of human HOXA9 and HOXA9T. MIM, MEIS1 interaction motif; HD, homeobox domain; yellow box, tryptophan consensus motif for PBX binding.

