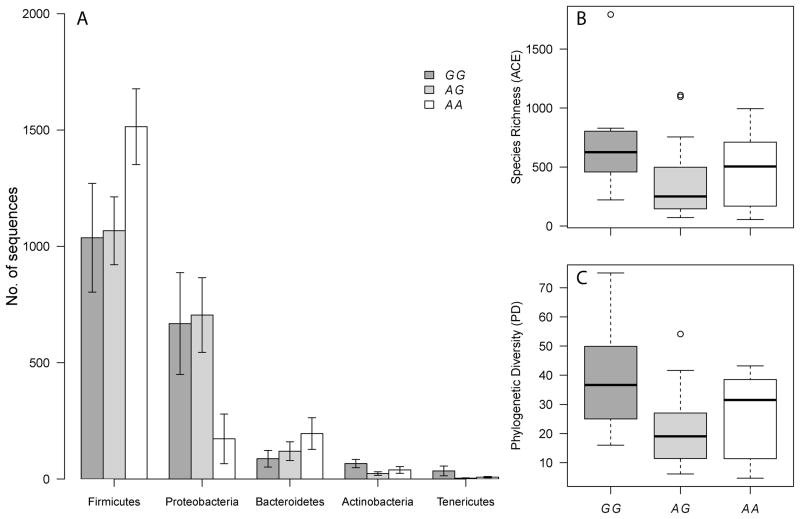
Figure 3. Influence of FUT2 genotype on phyla abundances and alpha diversity.
(A)
Mean abundances (± SE) of the major phyla with respect to genotype at the nonsense SNP rs601338 (W(TGG)→*(TAG). (B) The Abundance based Coverage Estimator (ACE) as a measure of the approximated species richness [35] (C) Alpha diversity measured as the sum of the total branch length in each sample (i.e. Phylogenetic Diversity) [36]. All values are based on the normalized dataset (2,000 reads per individual).

