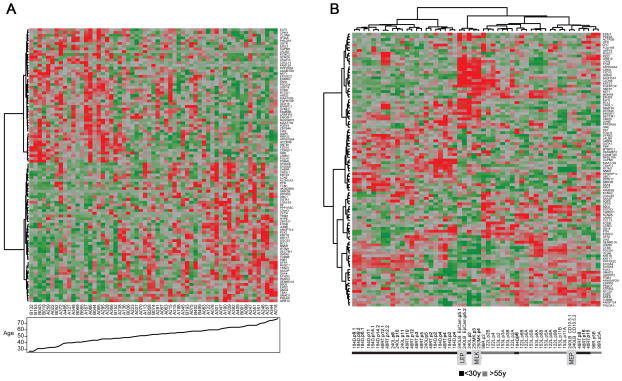
Figure 2.
A 100 gene signature stratifies human mammary epithelial cells by age. (A) The 100 most variable age-dependent genes identified from a set of 59 laser captured micro-dissected (LCM) phenotypically normal human mammary epithelium samples stratified the gene expression profiles by age. (B) The same signature clustered gene expression profiles of multiple passages and replicates of HMEC strains 184, 48RT, and 240L (<30y) and 122L, 153, and 96R (>55y), in an age-dependent manner. Heat maps represent Z-scores for each gene, where red represents higher expression and green represents lower expression. A positive-fold change represents a higher expression in samples from younger women. Specimen names are shown just below the heat maps. Profiles from FACS-enriched EpCam+ (LEP) and CD10+ (MEP) 240L HMEC, and luminal 250MK HMEC from isolated milk (MILK) are indicated. Samples from multiple passages of each HMEC strain are shown (passage is denoted with ‘p’), and most were analyzed with biological replicates (denoted either with ‘.1 vs .2’ or ‘A vs B’).

